<?xml version="1.0" encoding="utf-8"?><feed xmlns="http://www.w3.org/2005/Atom" ><generator uri="https://jekyllrb.com/" version="3.10.0">Jekyll</generator><link href="https://chart-horizon.com/feed.xml" rel="self" type="application/atom+xml" /><link href="https://chart-horizon.com/" rel="alternate" type="text/html" /><updated>2026-07-18T09:30:03+00:00</updated><id>https://chart-horizon.com/feed.xml</id><title type="html">ChartHorizon</title><subtitle>Weekly futures positioning notes — where season, producer positioning, hedging program and term structure line up. Data: ChartHorizon.</subtitle><author><name>ChartHorizon</name></author><entry><title type="html">The Hedgers’ Ledger — 2026-07-18</title><link href="https://chart-horizon.com/2026/07/18/hedgers-ledger/" rel="alternate" type="text/html" title="The Hedgers’ Ledger — 2026-07-18" /><published>2026-07-18T00:00:00+00:00</published><updated>2026-07-18T00:00:00+00:00</updated><id>https://chart-horizon.com/2026/07/18/hedgers-ledger</id><content type="html" xml:base="https://chart-horizon.com/2026/07/18/hedgers-ledger/"><![CDATA[<p>The report dated 14 July 2026 shows the commercial book thin on conviction: no market in this issue’s coverage sits at a positioning high, and Cotton #2 stands as the lone entry at a positioning low — a fresh print, new to the ledger this week. The board beyond these pages carries its own business. One extreme, one side — there is nothing in that shape to force a remark.</p>

<table>
  <thead>
    <tr>
      <th>Market</th>
      <th>Side</th>
      <th>Percentile</th>
      <th>New</th>
    </tr>
  </thead>
  <tbody>
    <tr>
      <td>Cotton #2</td>
      <td><span class="mark-bear">▼ LOW</span></td>
      <td>4th</td>
      <td>New</td>
    </tr>
  </tbody>
</table>

<hr />

<h2 id="cotton-2--commercials-at-a-3-year-low">Cotton #2 — commercials at a 3-year LOW</h2>

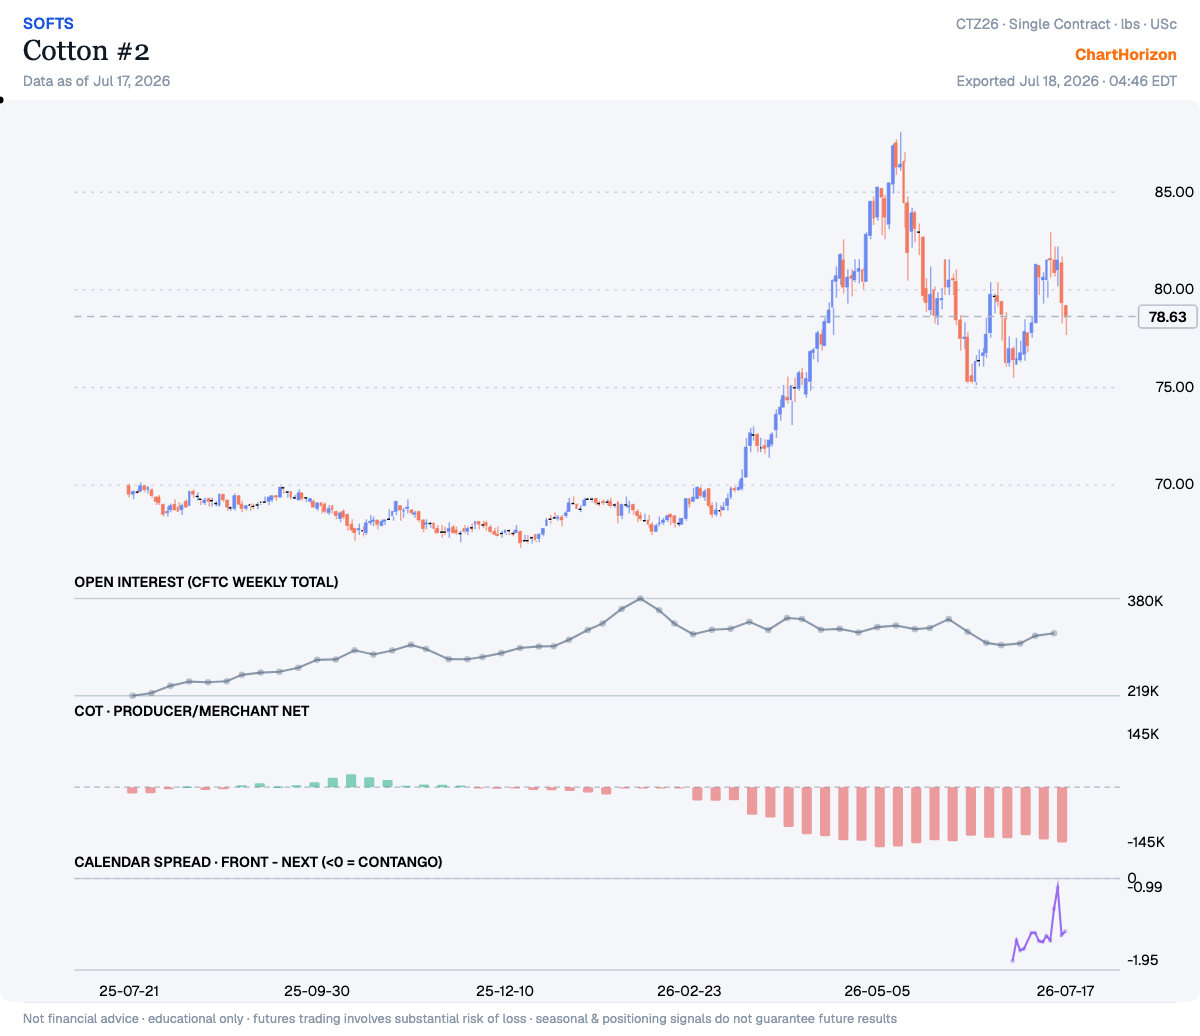
<p><img src="/assets/posts/2026-07-18-hedgers-ledger/cards/cotton.png" alt="Cotton #2 — commercials net positioning" width="1200" height="1036" loading="lazy" /></p>

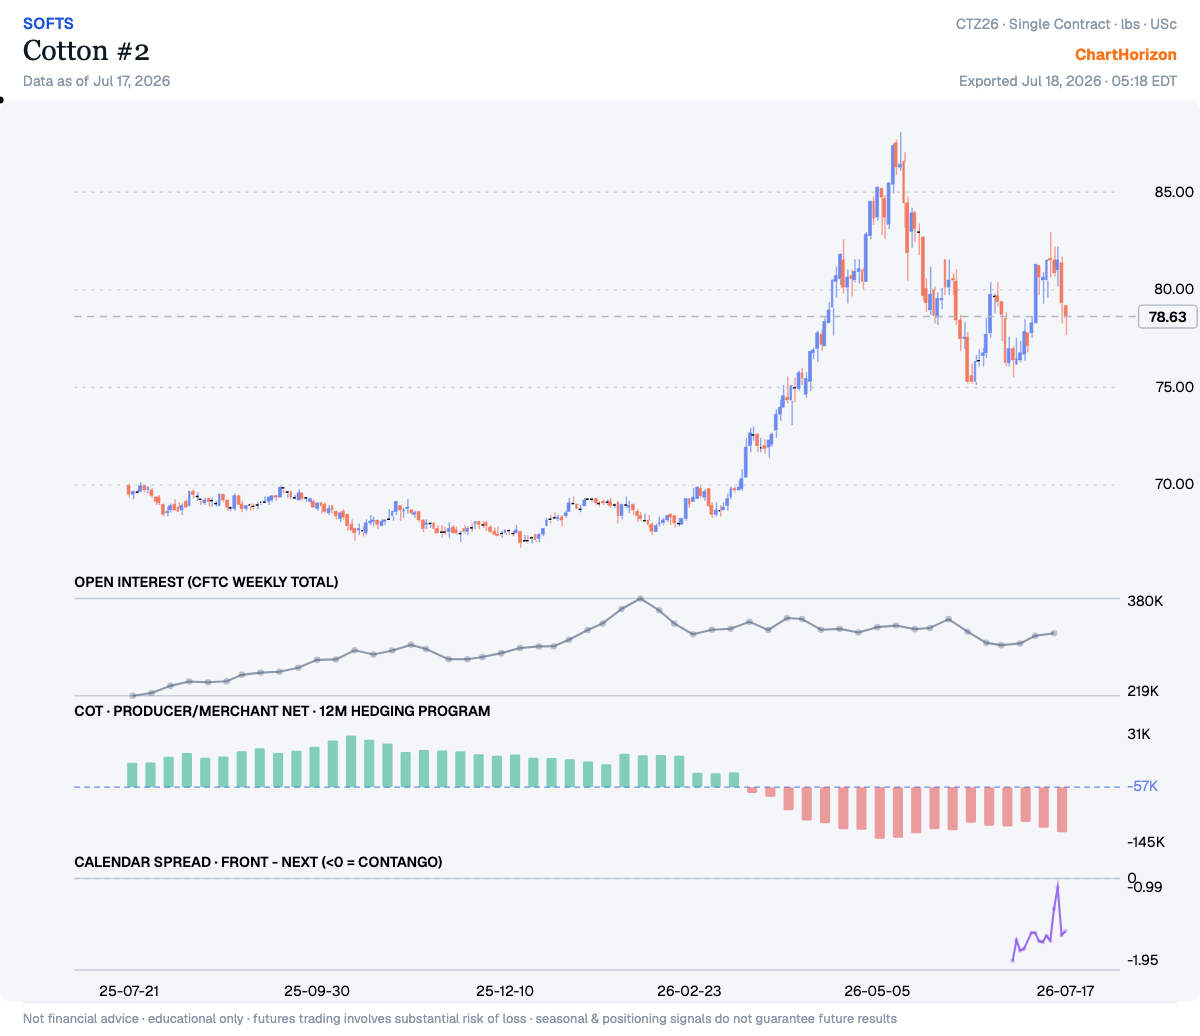
<p>Producer/Merchant Net sits at the 4th percentile of its ~3-year range — the commercials (hedgers, the “smart-money” side) have been heavy net sellers. Net: -133,903 contracts (as of 2026-07-14). New this week.</p>]]></content><author><name>ChartHorizon</name></author><summary type="html"><![CDATA[Weekly COT extremes — where the commercial hedgers sit at the edge of their multi-year positioning range. Data: CFTC via ChartHorizon.]]></summary><media:thumbnail xmlns:media="http://search.yahoo.com/mrss/" url="https://chart-horizon.com/assets/posts/2026-07-18-hedgers-ledger/cards/cotton.png" /><media:content medium="image" url="https://chart-horizon.com/assets/posts/2026-07-18-hedgers-ledger/cards/cotton.png" xmlns:media="http://search.yahoo.com/mrss/" /></entry><entry><title type="html">The Weekly Tape — Three Rallies, One Seller</title><link href="https://chart-horizon.com/2026/07/18/weekly-tape/" rel="alternate" type="text/html" title="The Weekly Tape — Three Rallies, One Seller" /><published>2026-07-18T00:00:00+00:00</published><updated>2026-07-18T00:00:00+00:00</updated><id>https://chart-horizon.com/2026/07/18/weekly-tape</id><content type="html" xml:base="https://chart-horizon.com/2026/07/18/weekly-tape/"><![CDATA[<p>A rally is a claim, and a claim needs signatures. When the public buys a move, I want to know who
is on the other side of the slip — because if the seller is the man who owns the goods, the man
whose business it is to know what the goods are worth, then the advance is not a verdict; it is a
transaction. This week the board hands me three advances to read, in three different corners of
the market, and when I turn each one over I find the same name signing the sell side every time.
The grain producers are selling the pop in corn and wheat. The sugar and cotton trade is selling
every bounce, over some of the deepest commercial short books on the board. And in the stock indices, the commercial book
that was long in early June has walked clear across the ledger and come out short — while the
averages take turns failing at the highs. Three rallies, one seller. That is the week.</p>

<hr />

<h2 id="the-grains--a-rally-the-producers-are-selling">The grains — a rally the producers are selling</h2>

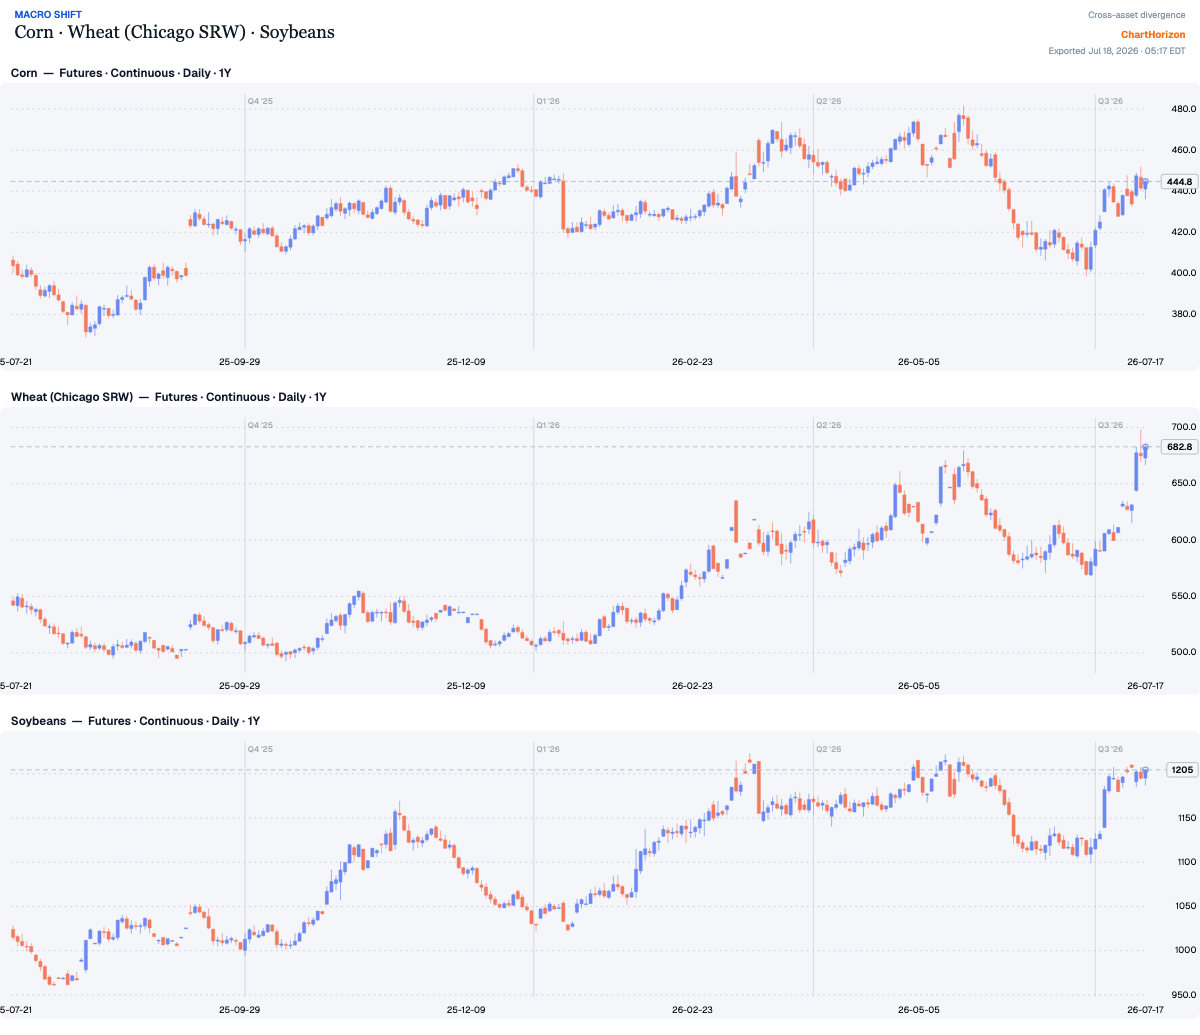
<p><img src="/assets/posts/2026-07-18-weekly-tape/cards/grains.png" alt="Macro Shift — Corn, Chicago wheat and soybeans: wheat spikes to close the week at a one-year high while corn rallies back into its spring range" width="1200" height="1035" loading="lazy" /></p>

<p>On its face the grain board had a fine week. Wheat ran eight percent in five sessions and closed
Friday at 682¾, the highest weekly close in a year, pressing at the 700 line. Corn is up better
than ten percent from its late-June washout at 402, back to 444¾. The
crowd reads that tape and sees a bull market starting. I read the slips underneath it, and I find
three reasons to withhold my signature.</p>

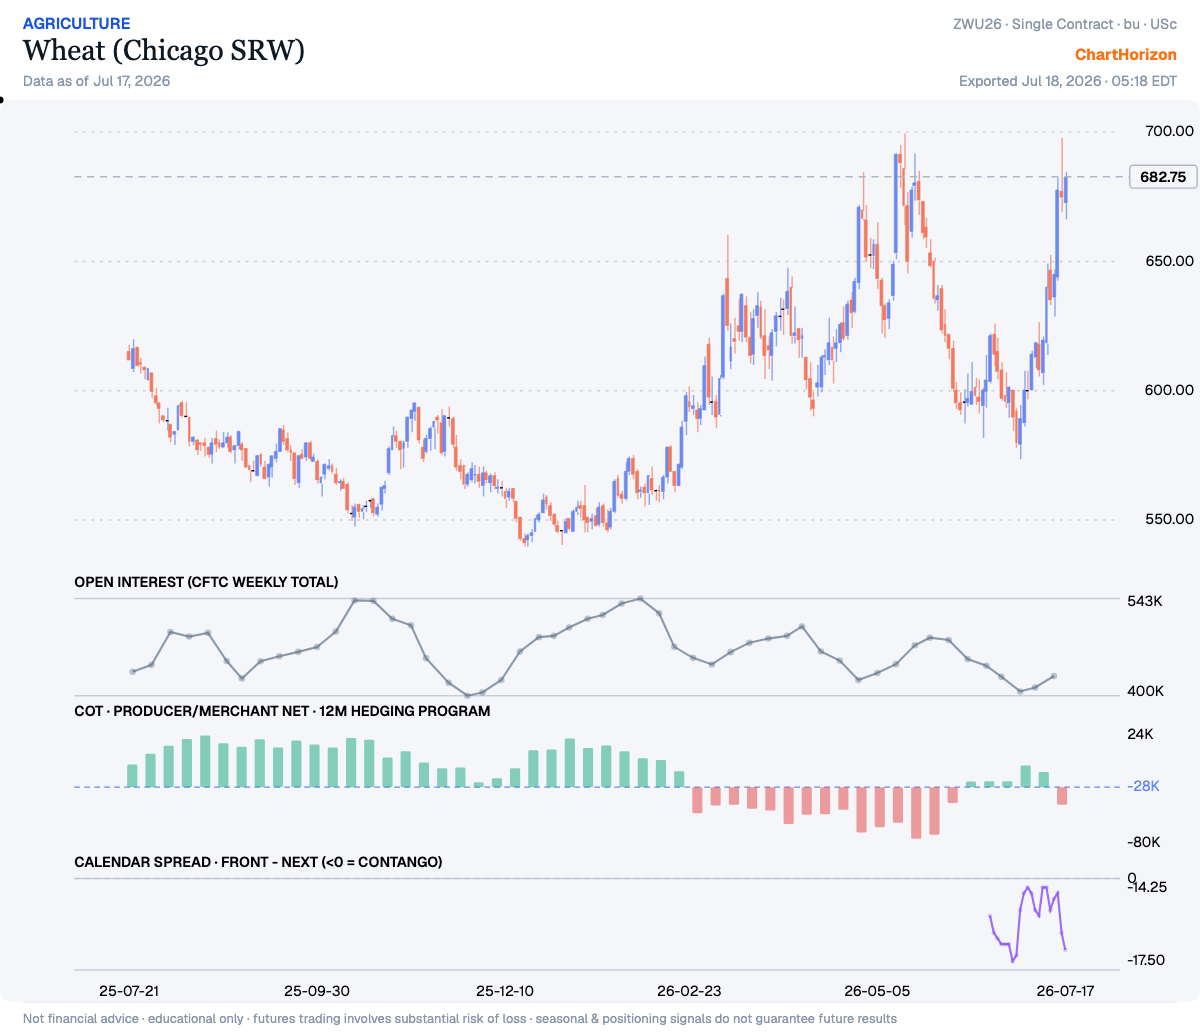
<p>First, the seller. In the July 14 Commitments report — taken while wheat was running — the wheat
producers and merchants more than <em>tripled</em> their net short, from 12,800 contracts to 45,600 in a
single reporting week, pushing the book below their own twelve-month hedging program. The men who
grow the stuff, store the stuff, and ship the stuff met this rally with both hands. Corn tells it
the same way: the producer book has deepened from 353,000 net short at the end of June to 417,100
now — they sold better than 60,000 contracts into the bounce. When the price of a thing goes up
and the people closest to the thing sell it harder, the advance is being <em>supplied</em>, not chased.</p>

<p><img src="/assets/posts/2026-07-18-weekly-tape/cards/wheat.png" alt="Wheat (Chicago SRW), September contract — the spike to 682¾ over a producer book swinging sharply short and a calendar spread stuck in contango" width="1200" height="1036" loading="lazy" /></p>

<p>Second, the carry. A market that is genuinely short of grain pays up for the nearby delivery; the
front month goes to a premium because somebody needs the goods <em>now</em>. Neither grain does anything
of the kind. September wheat closed 17 cents under December; September corn sits 22¾ cents under
December, and that discount <em>widened</em> while the price rallied. The cash market, in other words,
declined to co-sign the futures move. A rally in the deferred hope while the nearby delivery goes
begging is the shape a short-covering scramble leaves on the tape — not the shape of scarcity.</p>

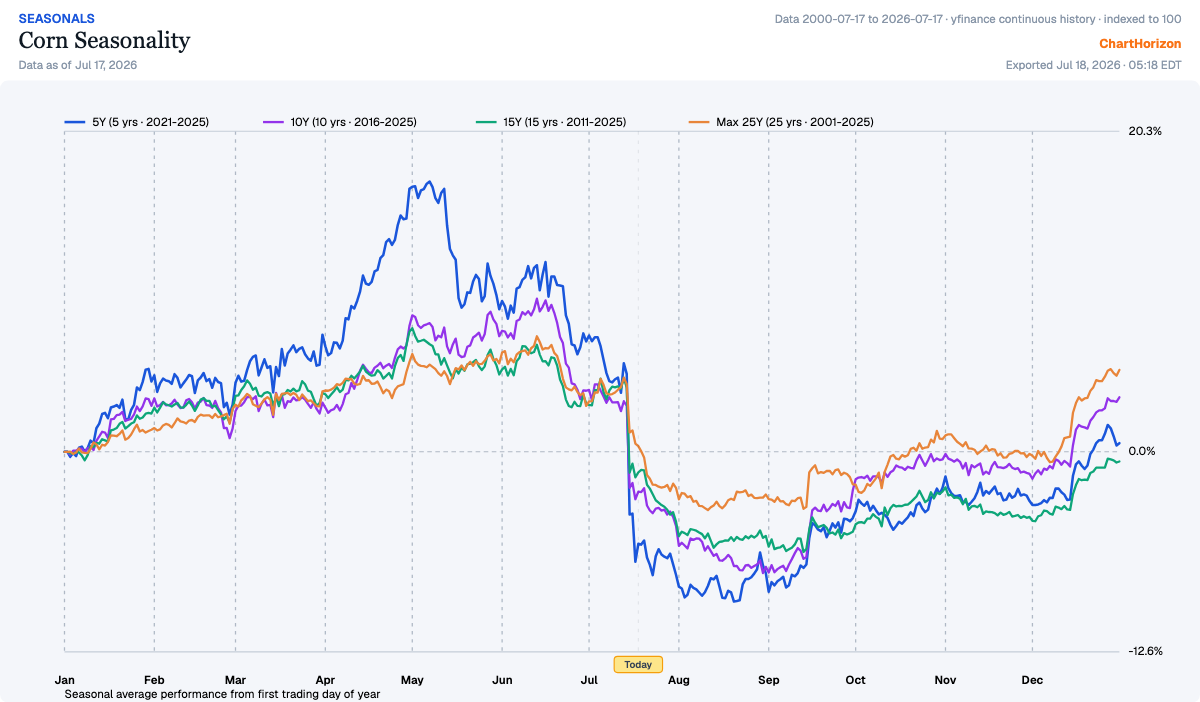
<p><img src="/assets/posts/2026-07-18-weekly-tape/cards/corn-seasonal.png" alt="Corn seasonality — every curve from five to twenty-five years breaks sharply lower from mid-July into an August–September trough, and the Today marker stands at the edge of the cliff" width="1200" height="702" loading="lazy" /></p>

<p>Third, the calendar. Look where “Today” stands on corn’s seasonal chart: at the lip of the
steepest downhill stretch of its whole year. Every curve — five-year, ten, fifteen, twenty-five —
rolls off a cliff from mid-July into an August trough, as the market takes the measure of the crop
it can finally see. ChartHorizon’s gated seasonal gauge has corn inside a bearish window through
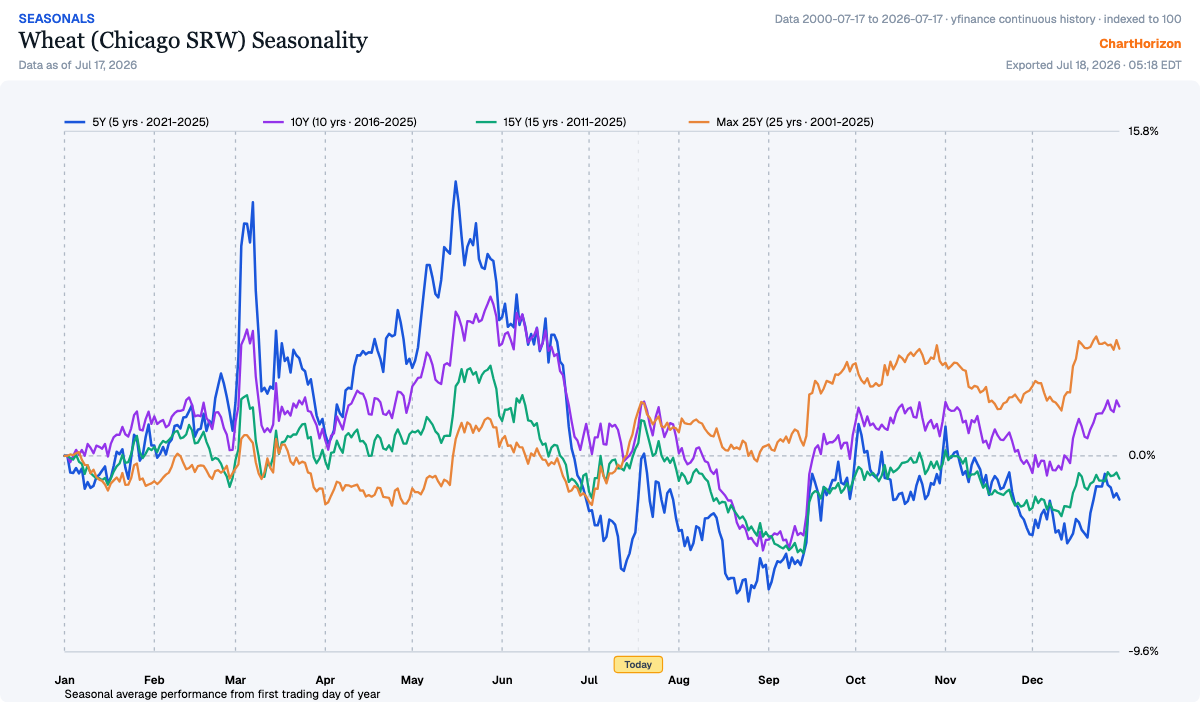
August 3. Wheat is a week behind it: the gauge flips bearish on July 26, and the modern curves
slide from late July to a harvest-pressure low in early September.</p>

<p><img src="/assets/posts/2026-07-18-weekly-tape/cards/wheat-seasonal.png" alt="Wheat seasonality — the five-, ten- and fifteen-year curves slide from late July into a late-August trough before the autumn recovery" width="1200" height="702" loading="lazy" /></p>

<p>Now the honest ledger. Corn’s board is not unanimous — the hedging-program gauge still reads
bullish there, one dissenting light among three bearish, and a dissent is to be respected. And a
market that closes the week at a 52-week high, as wheat just did, is never to be shorted on
opinion; strength like that can run further than any reasoning about it. I am not calling the top
of this move. I am saying the move has not proved itself: the producers are selling it, the cash
market will not confirm it, and the season is about to lean on it. A false move is exposed by its
failure, not by a man’s suspicion of it. Let wheat print its first failure under 700 — a sharp
reversal that holds — and the story writes itself. Until then the burden of proof sits on the
rally, and the rally is borrowing, not earning.</p>

<hr />

<h2 id="the-softs--sold-at-the-top-of-every-bounce">The softs — sold at the top of every bounce</h2>

<p><img src="/assets/posts/2026-07-18-weekly-tape/cards/cotton.png" alt="Cotton #2, December contract — the mid-July pop above 80 rejected inside two sessions while the producer book sits at its deepest short in three years" width="1200" height="1036" loading="lazy" /></p>

<p>Cotton showed the whole pattern in miniature this week. Midweek it poked above 80½ — its best
close in nearly two months — and by Friday it had given the entire pop back and more, down three and a
half percent on the week to the 77 line. That is the second time since May the market has run at
the low 80s and been thrown back. And underneath it the producer and merchant book has been
grinding to its deepest net short in three years — 133,900 contracts — an extreme fresh enough that it walked onto <a href="/2026/07/18/hedgers-ledger/">this week’s Hedgers’
Ledger</a> as a new arrival. The pattern of a market that cannot hold a
two-day rally over a record commercial short is not the pattern of a bottom. The seasonal chart
offers the bull no help either: the gauge is neutral today and turns outright bearish on
August 29.</p>

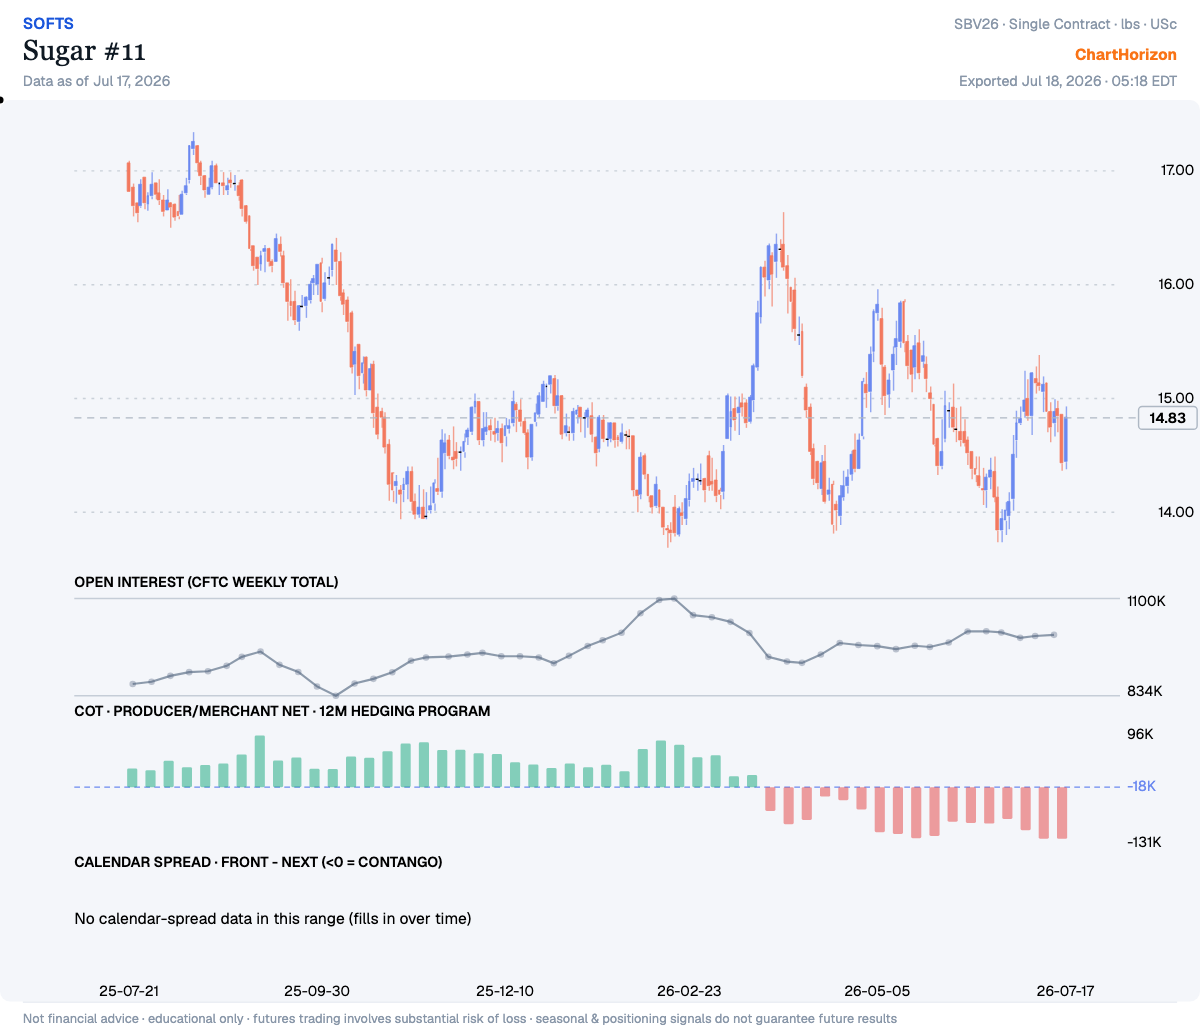
<p><img src="/assets/posts/2026-07-18-weekly-tape/cards/sugar.png" alt="Sugar #11, October contract — a year of lower highs stepping down from 17 to the 14s, with the producer book near its deepest short of the cycle" width="1200" height="1036" loading="lazy" /></p>

<p>Sugar is the same book with a slower clock. Read the year on the October contract: 16.8 in
February, 16 flat in May, 15.2 at the start of July — a staircase of lower highs, each rally sold
a little sooner than the last, working down into the 14s. Friday’s bounce to 14.83 does not
change the shape of that staircase; it is the same one-day flourish that has appeared at every
step of the decline. The producers sit 131,200 contracts net short, having
added better than 40,000 in three weeks — the selling into strength here is not an event, it is
a policy.</p>

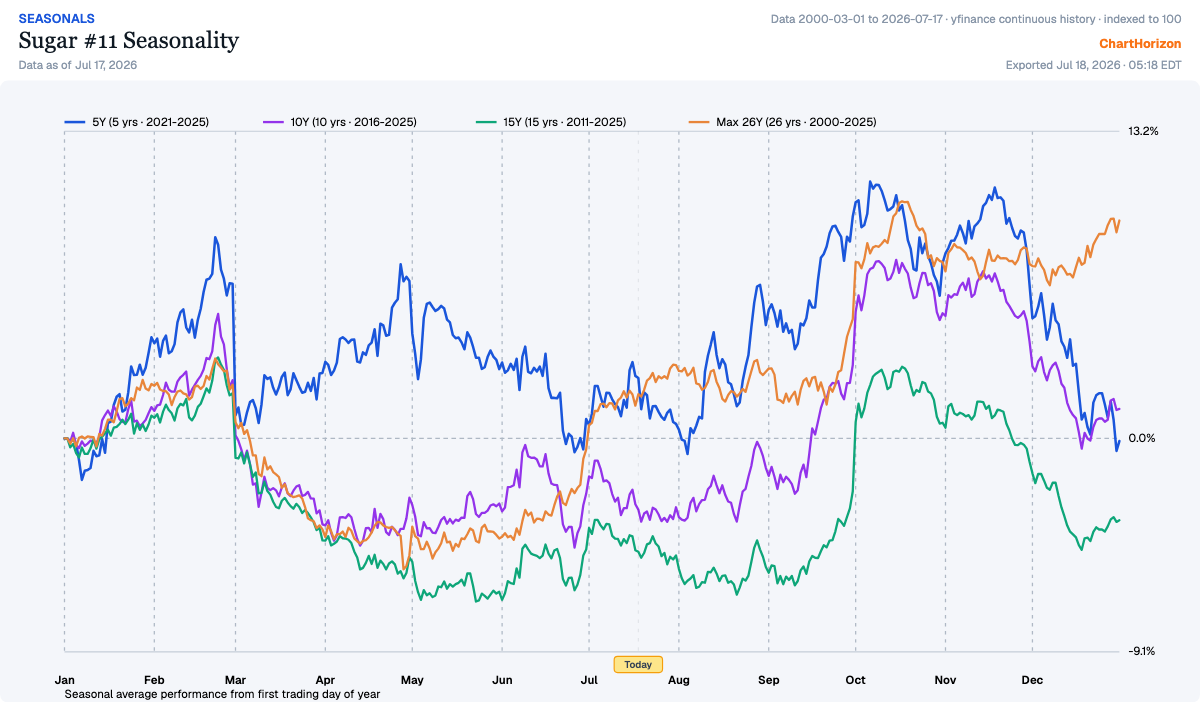
<p><img src="/assets/posts/2026-07-18-weekly-tape/cards/sugar-seasonal.png" alt="Sugar seasonality — the curves stay soft through August and then turn up hard into a September–October ramp" width="1200" height="702" loading="lazy" /></p>

<p>But mark the calendar, because sugar’s bear has a clock on him. The seasonal road is empty
through August — and then it is not: every curve on the chart turns up hard into September and
October, and the gated gauge flips bullish on September 2. Six weeks of open road, then the wind
changes. A short position in sugar is a tenant, not an owner, and his lease is dated. Press the
downtrend while the calendar is quiet; be gone before the October ramp arrives to squeeze the
late sellers.</p>

<hr />

<h2 id="the-indices--the-top-with-a-process-to-it">The indices — the top with a process to it</h2>

<p>A month ago, <a href="/2026/06/17/hollow-advance/">when the averages first stopped agreeing with each
other</a>, I wrote that the advance had gone hollow — and that hollow
things often make one more high before the floor goes. The tape has spent the four weeks since
obliging that sentence almost to the letter. The S&amp;P ran all the way back to the old top and
stopped: 7623¾ on June 2, 7620¼ on July 10 — a double top five weeks apart, three and a half
points between the two prints. The Dow, the narrowest and heaviest of the leaders, made its
yearly closing high on July 6, alone, exactly the way a distribution likes to send up its last
flare. And the Nasdaq — the growth index, the index that <em>led</em> the whole advance — never
confirmed either of them. Its recovery in late June fell just short of the June 2 top, and it has
fallen away in almost a straight line since: down four percent this week alone, closing Friday
within one percent of its June 10 low. The leader of the bull market is the first one back at the
floor. That ordering is not an accident; it is the process.</p>

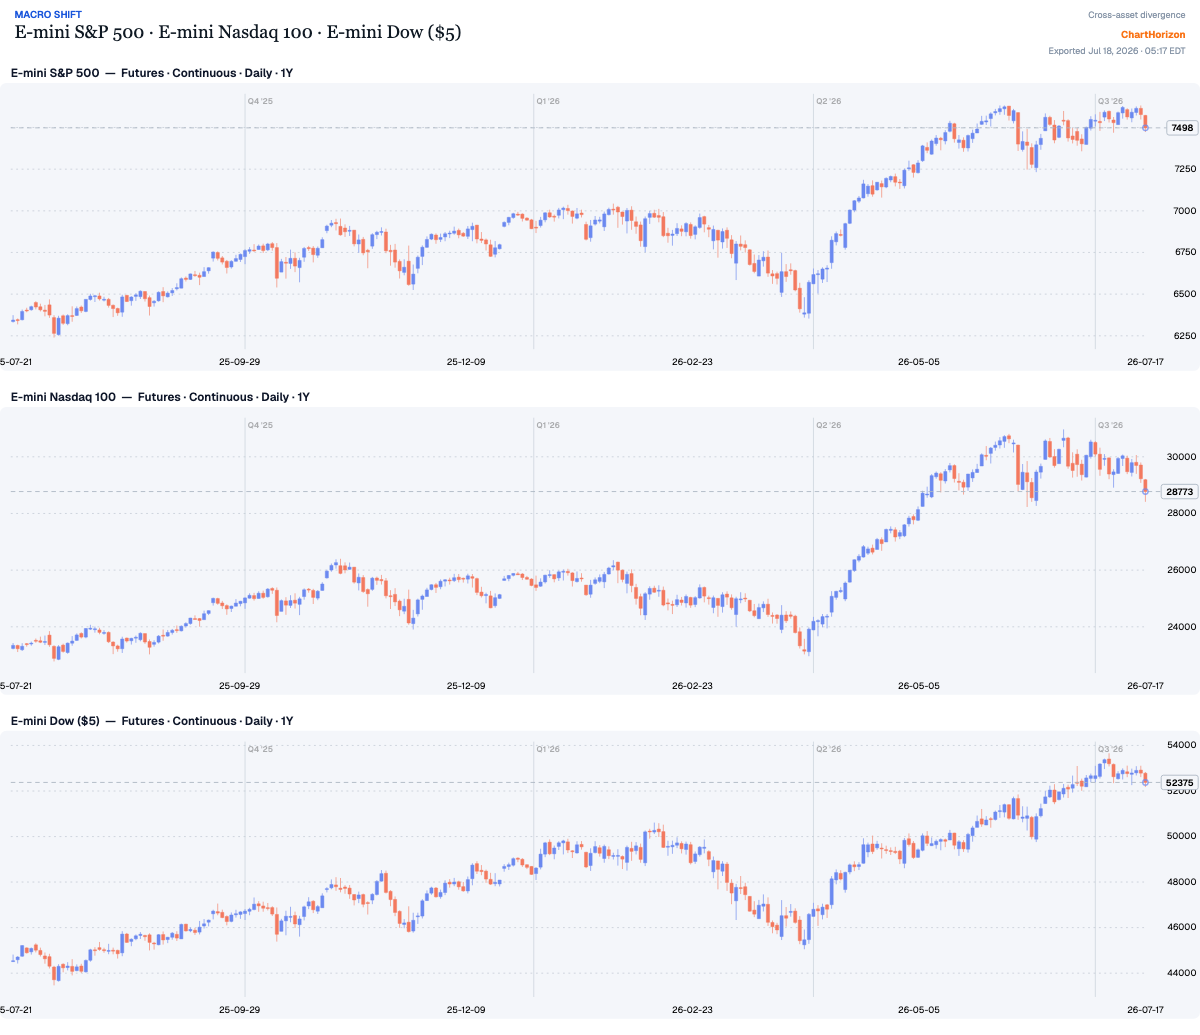
<p><img src="/assets/posts/2026-07-18-weekly-tape/cards/equities.png" alt="Macro Shift — E-mini S&amp;P 500, Nasdaq 100 and Dow: the S&amp;P double top near 7620, the Nasdaq breaking down toward its June low, the Dow holding nearest its July high" width="1200" height="1035" loading="lazy" /></p>

<p>Now set the positioning beside the price. On June 9 the S&amp;P commercial book stood 90,700
contracts net <em>long</em>. Five weeks later it stands 92,500 net <em>short</em> — a swing of more than
180,000 contracts, executed precisely across the weeks the index was pressing at its highs. The
Dow commercials have deepened from 2,900 short to 18,700 over the same stretch. I will keep the
ledger honest: the Nasdaq commercial book is roughly flat, a few thousand short, arguing nothing
— the Nasdaq’s evidence is its price, which is doing the arguing loudly enough. But the S&amp;P’s
book is the widest swing on the whole board this month, and it points one way: the interests that
were financing the advance in June are financing the other side of it in July.</p>

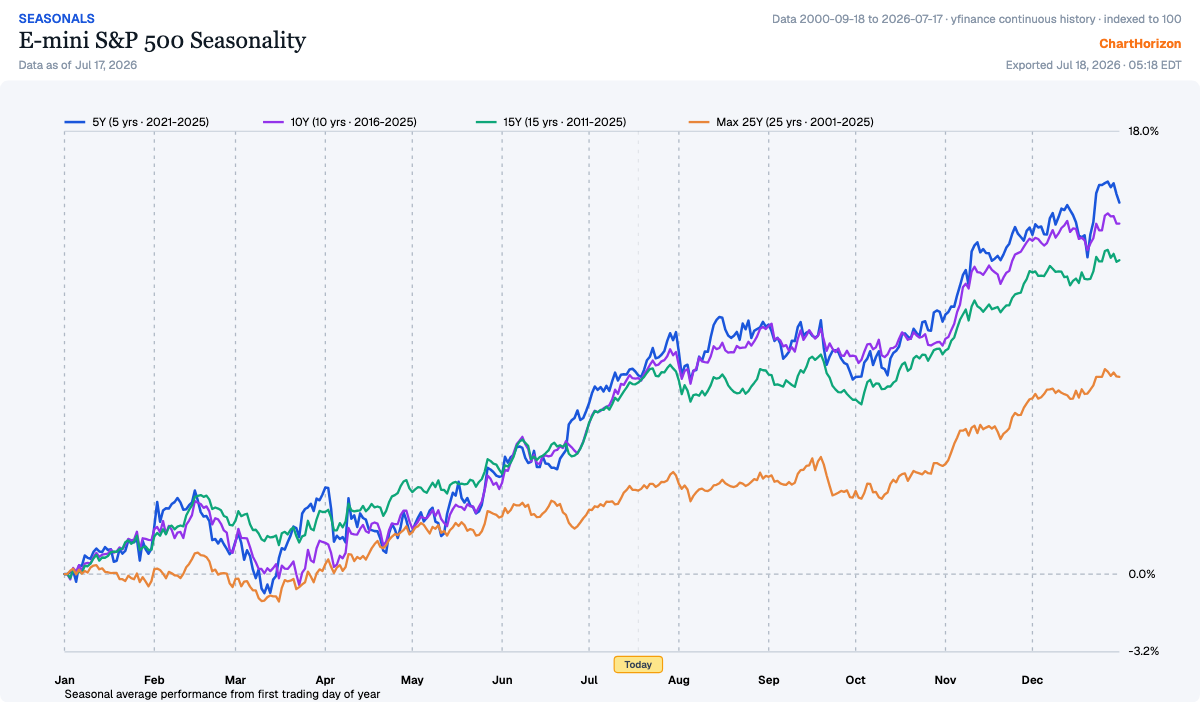
<p><img src="/assets/posts/2026-07-18-weekly-tape/cards/es-seasonal.png" alt="E-mini S&amp;P 500 seasonality — from late July through October the curves go shelf-flat, the one soft stretch in a chart that otherwise climbs all year" width="1200" height="702" loading="lazy" /></p>

<p>The seasonal chart I will read to you straight, because it is not a bear’s chart. The S&amp;P’s
curves climb nearly all year; what they show from late July into October is not a cliff but a
shelf — the one flat, choppy stretch in the whole profile, with the gated gauge offering the
bull nothing before October 9. The Nasdaq’s window actually turns friendly in August. So let no
man tell you the season is what breaks this market; the season merely stops carrying it. That is
the stretch where an advance has to walk on its own legs — and this advance has just shown you a double top, a lone Dow flare, and its leader on the floor.</p>

<p>What would prove the top is plain, and it has not printed yet. The June 10 closes are the trap
door under this market: 28,554 on the Nasdaq, 7278½ on the S&amp;P. While those floors hold, all of
this — the double top, the flipped book, the leader’s slide — is distribution <em>suspected</em>, and a
suspicion is not a position. Let the Nasdaq close under its June low and fail to recover it, and
suspicion becomes evidence; let the S&amp;P follow through its own floor and evidence becomes a
trend. A top is not a moment but a process, and a process is traded at its confirmation, not at
its rumor.</p>

<hr />

<h2 id="the-read--one-signature-on-every-slip">The read — one signature on every slip</h2>

<p>Step back and look at the whole board at once, because the week’s lesson is not in any single
market — it is in the repetition. Wheat makes a one-year high and the men with the grain triple
their shorts. Cotton pokes above eighty and is thrown back in two sessions over the deepest
commercial short in three years. The S&amp;P walks up to its old high a second time and the book
that was long in June meets it there, short. Everywhere the crowd is paying up, the interests
closest to the goods are handing over inventory — quietly, weekly, in the one report that
publishes their signature. I have said it for as long as I have read a tape: the public buys the move,
the trade sells the merchandise, and the reckoning arrives on its own schedule.</p>

<p>But knowing who is selling is not the same as knowing when the price agrees, and the discipline
this week is the discipline of the trigger. The grain story wants wheat’s first failure under</p>
<ol>
  <li>The index story wants the June floors — 28,554 and 7278½ — taken out on closes. The softs
are the furthest along, trend and book and season all leaning together, and even there the sugar
short carries a September expiry date on his conviction. Nothing on this board rewards the man
who anticipates; every card on it rewards the man who waits with his levels marked. The line of
least resistance is bending — in the grains, in the softs, in the averages, all in the same
direction. I let it snap before I lean on it. Anticipate nothing; weigh everything. The big money
is not in the guessing; it is in the waiting.</li>
</ol>]]></content><author><name>ChartHorizon</name></author><summary type="html"><![CDATA[Wheat closes at a 52-week high while producers triple their shorts; corn pops into its worst seasonal stretch; sugar and cotton are sold at every bounce; and S&P commercials flip from long to short as a double top forms. A Livermore-voice intermarket read, July 18, 2026.]]></summary><media:thumbnail xmlns:media="http://search.yahoo.com/mrss/" url="https://chart-horizon.com/assets/posts/2026-07-18-weekly-tape/cards/equities.png" /><media:content medium="image" url="https://chart-horizon.com/assets/posts/2026-07-18-weekly-tape/cards/equities.png" xmlns:media="http://search.yahoo.com/mrss/" /></entry><entry><title type="html">The Hedgers’ Ledger — 2026-07-11</title><link href="https://chart-horizon.com/2026/07/11/hedgers-ledger/" rel="alternate" type="text/html" title="The Hedgers’ Ledger — 2026-07-11" /><published>2026-07-11T00:00:00+00:00</published><updated>2026-07-11T00:00:00+00:00</updated><id>https://chart-horizon.com/2026/07/11/hedgers-ledger</id><content type="html" xml:base="https://chart-horizon.com/2026/07/11/hedgers-ledger/"><![CDATA[<p>The COT report dated 7 July 2026 finds the hedger book leaning hard to one side: five markets register positioning highs against the three-year window, and not a single market sits at a low. Three of those five — New Zealand Dollar, WTI Crude Oil, and Platinum — have pushed to fresh window records, while the New Zealand Dollar and Silver enter the extreme column for the first time this week. When the board fills up on one side without a counterweight, the tape is telling you something about where the professionals have already done their selling; the line of least resistance, at that point, is worth watching closely.</p>

<table>
  <thead>
    <tr>
      <th>Market</th>
      <th>Side</th>
      <th>Percentile</th>
      <th>New</th>
    </tr>
  </thead>
  <tbody>
    <tr>
      <td>New Zealand Dollar</td>
      <td><span class="mark-bull">▲ HIGH</span></td>
      <td>100th</td>
      <td>New</td>
    </tr>
    <tr>
      <td>WTI Crude Oil</td>
      <td><span class="mark-bull">▲ HIGH</span></td>
      <td>100th</td>
      <td> </td>
    </tr>
    <tr>
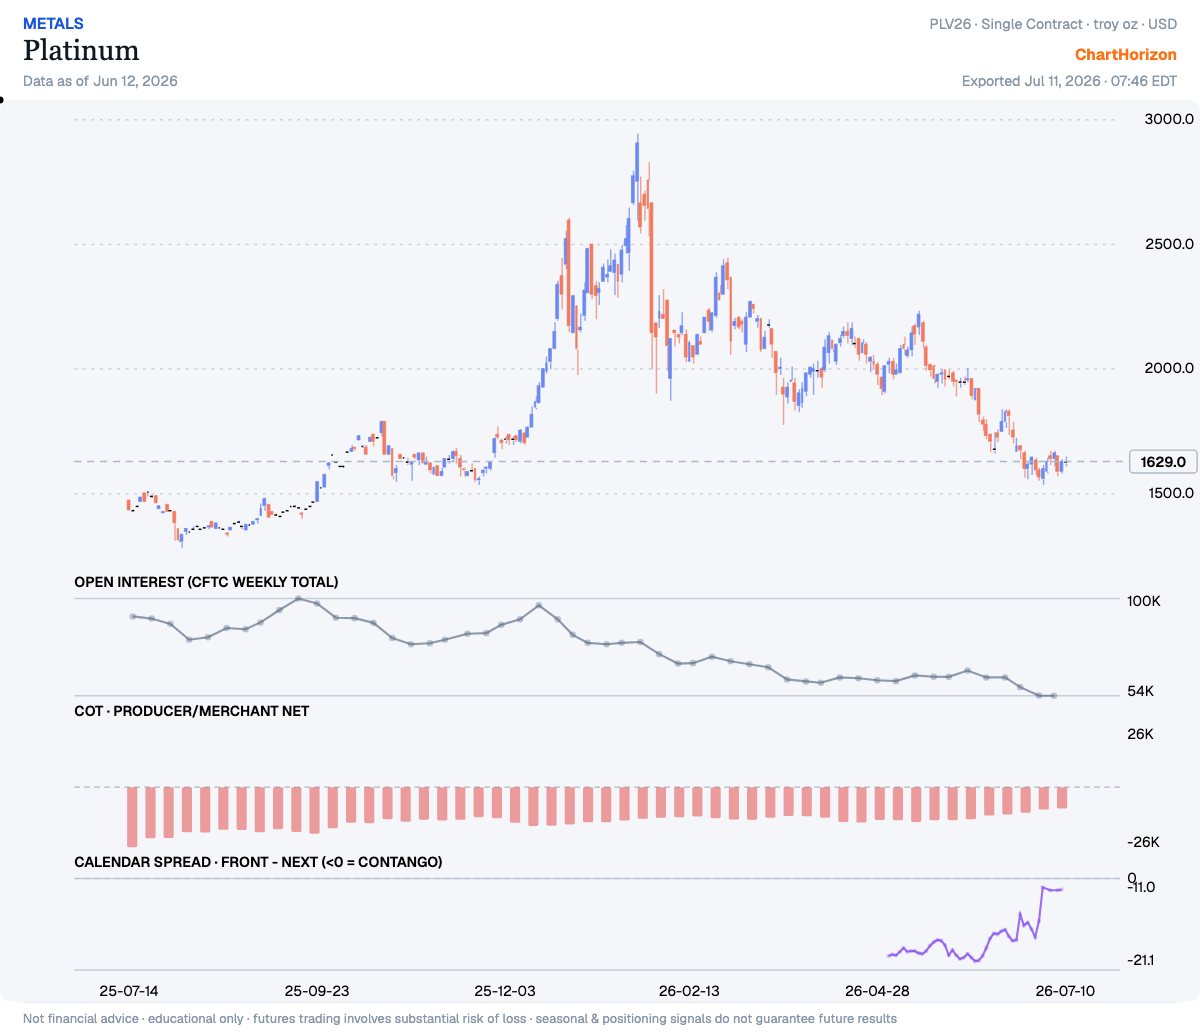
      <td>Platinum</td>
      <td><span class="mark-bull">▲ HIGH</span></td>
      <td>100th</td>
      <td> </td>
    </tr>
    <tr>
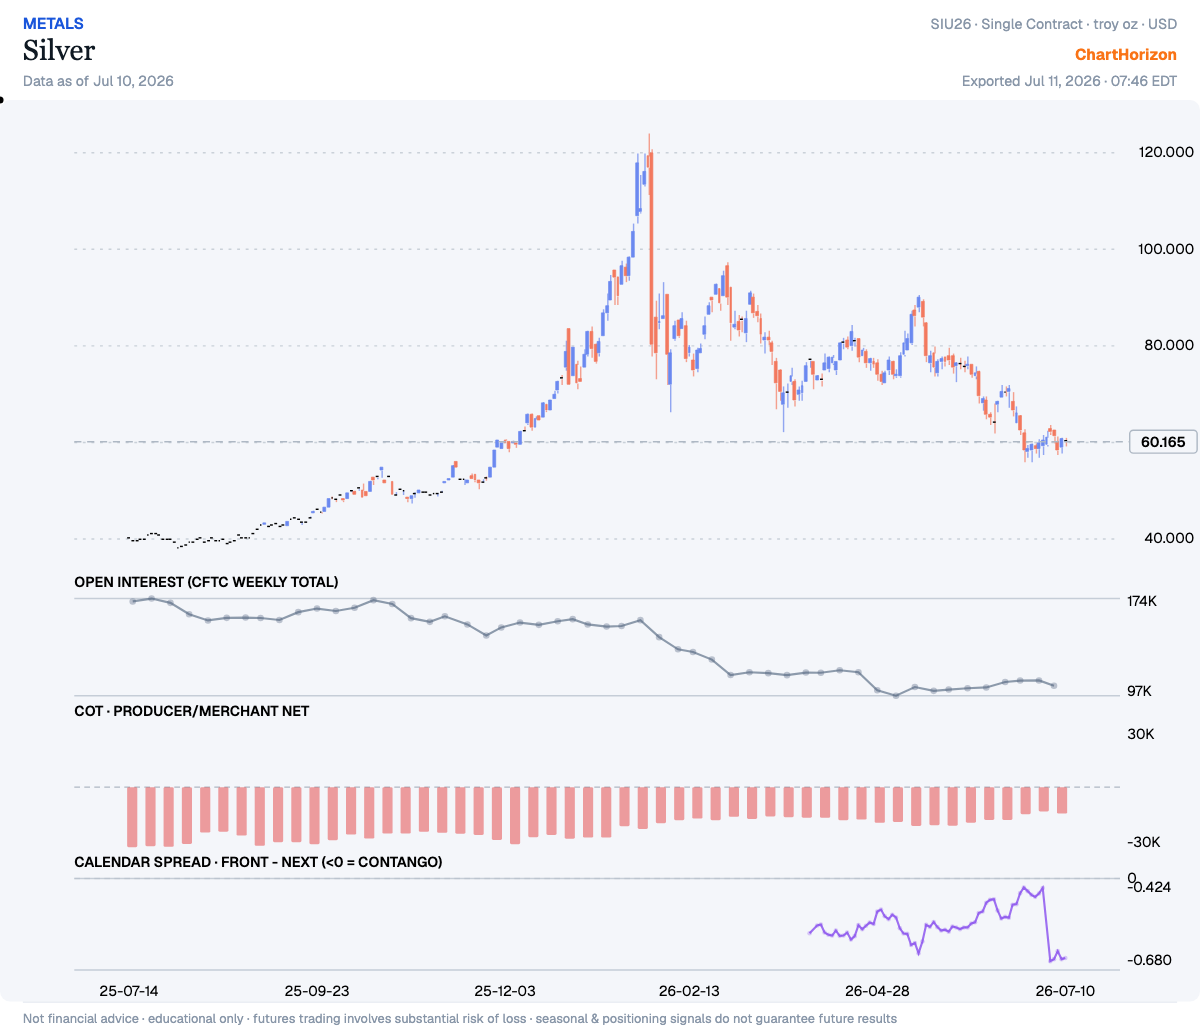
      <td>Silver</td>
      <td><span class="mark-bull">▲ HIGH</span></td>
      <td>99th</td>
      <td>New</td>
    </tr>
    <tr>
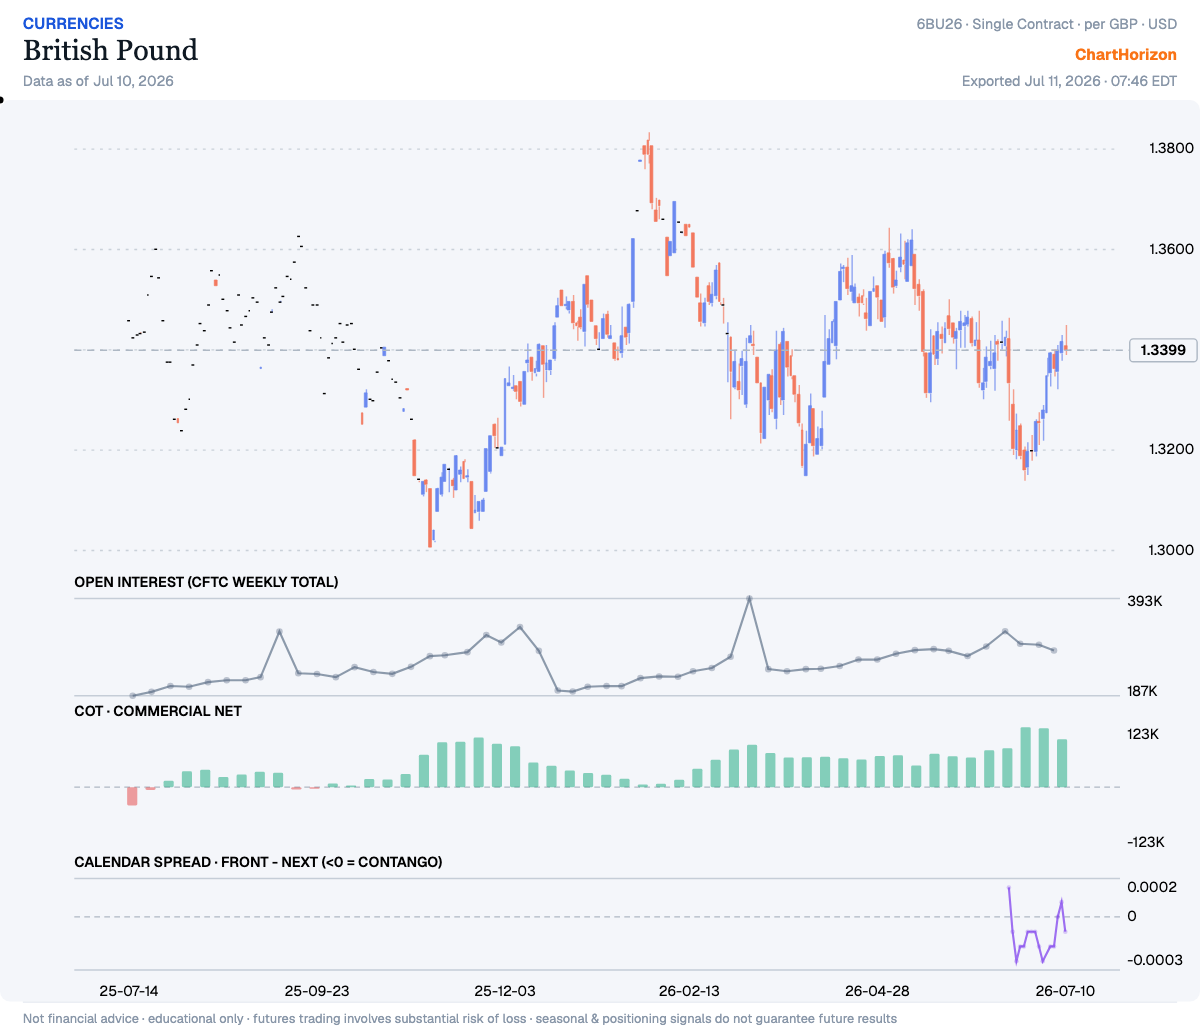
      <td>British Pound</td>
      <td><span class="mark-bull">▲ HIGH</span></td>
      <td>98th</td>
      <td> </td>
    </tr>
  </tbody>
</table>

<hr />

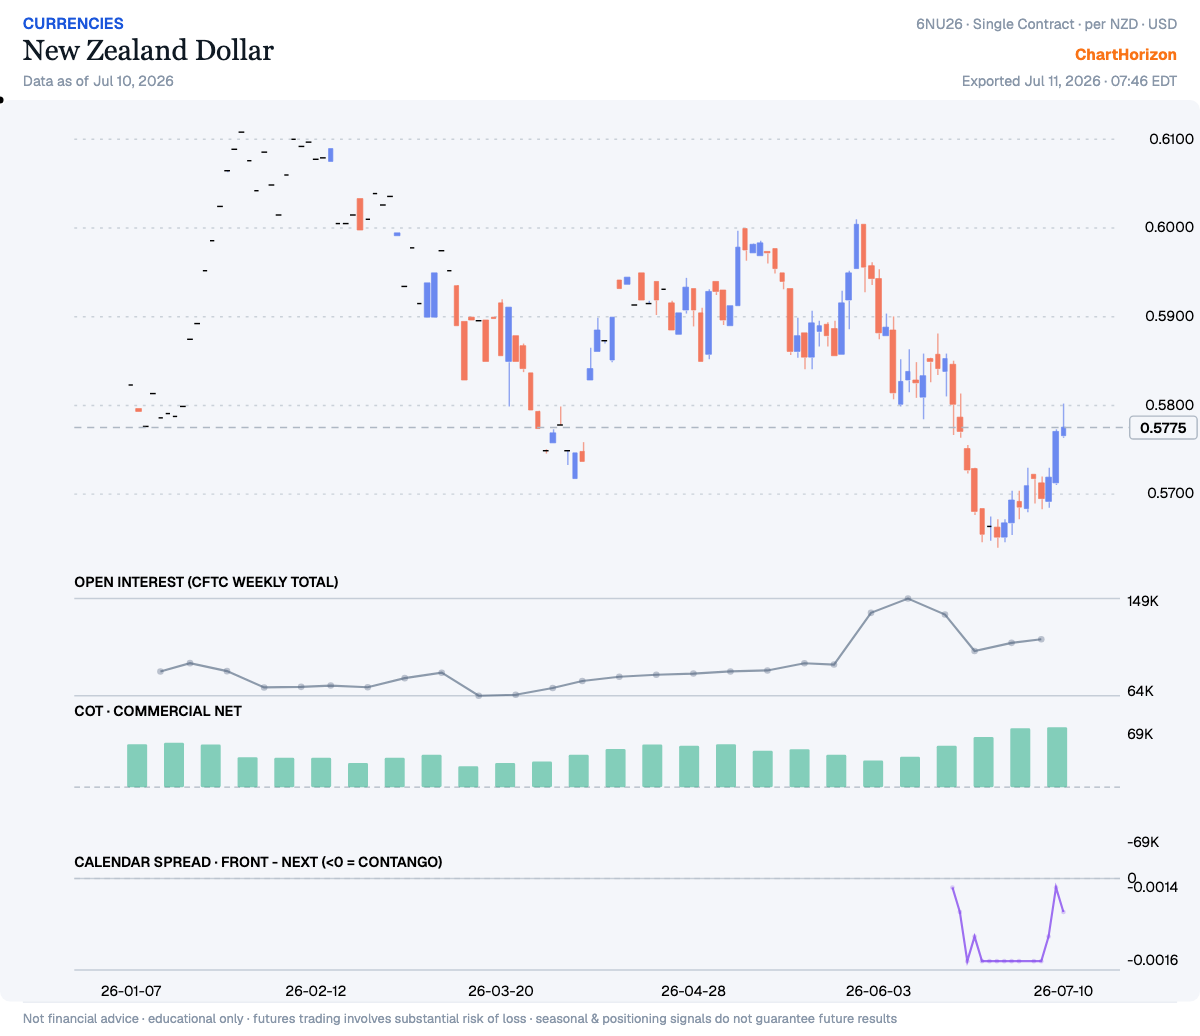
<h2 id="new-zealand-dollar--commercials-at-a-3-year-high-fresh-record">New Zealand Dollar — commercials at a 3-year HIGH (fresh record)</h2>

<p><img src="/assets/posts/2026-07-11-hedgers-ledger/cards/nzd_fx.png" alt="New Zealand Dollar — commercials net positioning" width="1200" height="1036" loading="lazy" /></p>

<p>Commercial Net sits at the 100th percentile of its ~3-year range — the commercials (hedgers, the “smart-money” side) have been heavy net buyers. That is a fresh record for the window. Net: +68,783 contracts (as of 2026-07-07). New this week.</p>

<hr />

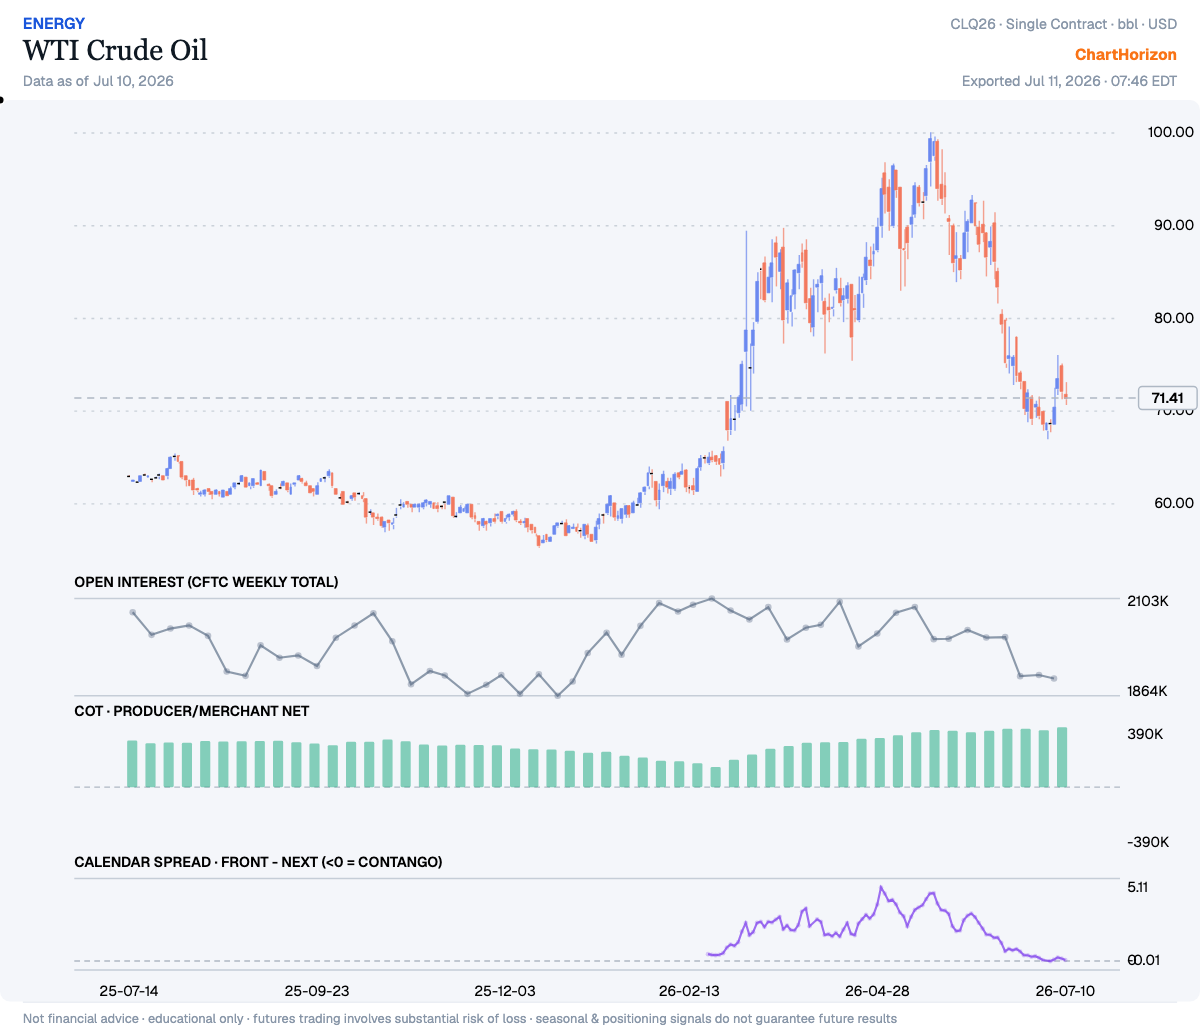
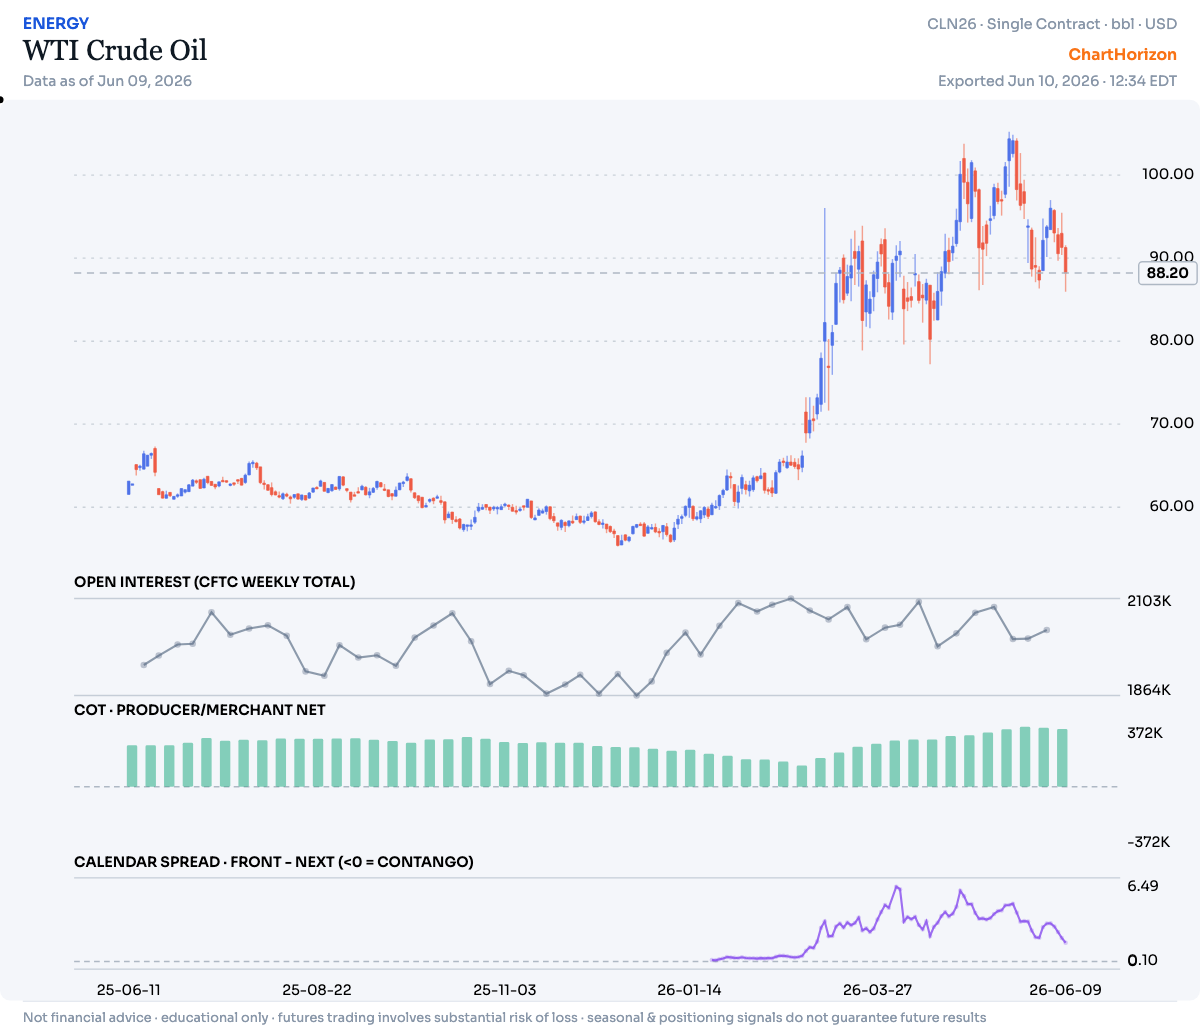
<h2 id="wti-crude-oil--commercials-at-a-3-year-high-fresh-record">WTI Crude Oil — commercials at a 3-year HIGH (fresh record)</h2>

<p><img src="/assets/posts/2026-07-11-hedgers-ledger/cards/wti_crude.png" alt="WTI Crude Oil — commercials net positioning" width="1200" height="1036" loading="lazy" /></p>

<p>Producer/Merchant Net sits at the 100th percentile of its ~3-year range — the commercials (hedgers, the “smart-money” side) have been heavy net buyers. That is a fresh record for the window. Net: +390,293 contracts (as of 2026-07-07).</p>

<hr />

<h2 id="platinum--commercials-at-a-3-year-high-fresh-record">Platinum — commercials at a 3-year HIGH (fresh record)</h2>

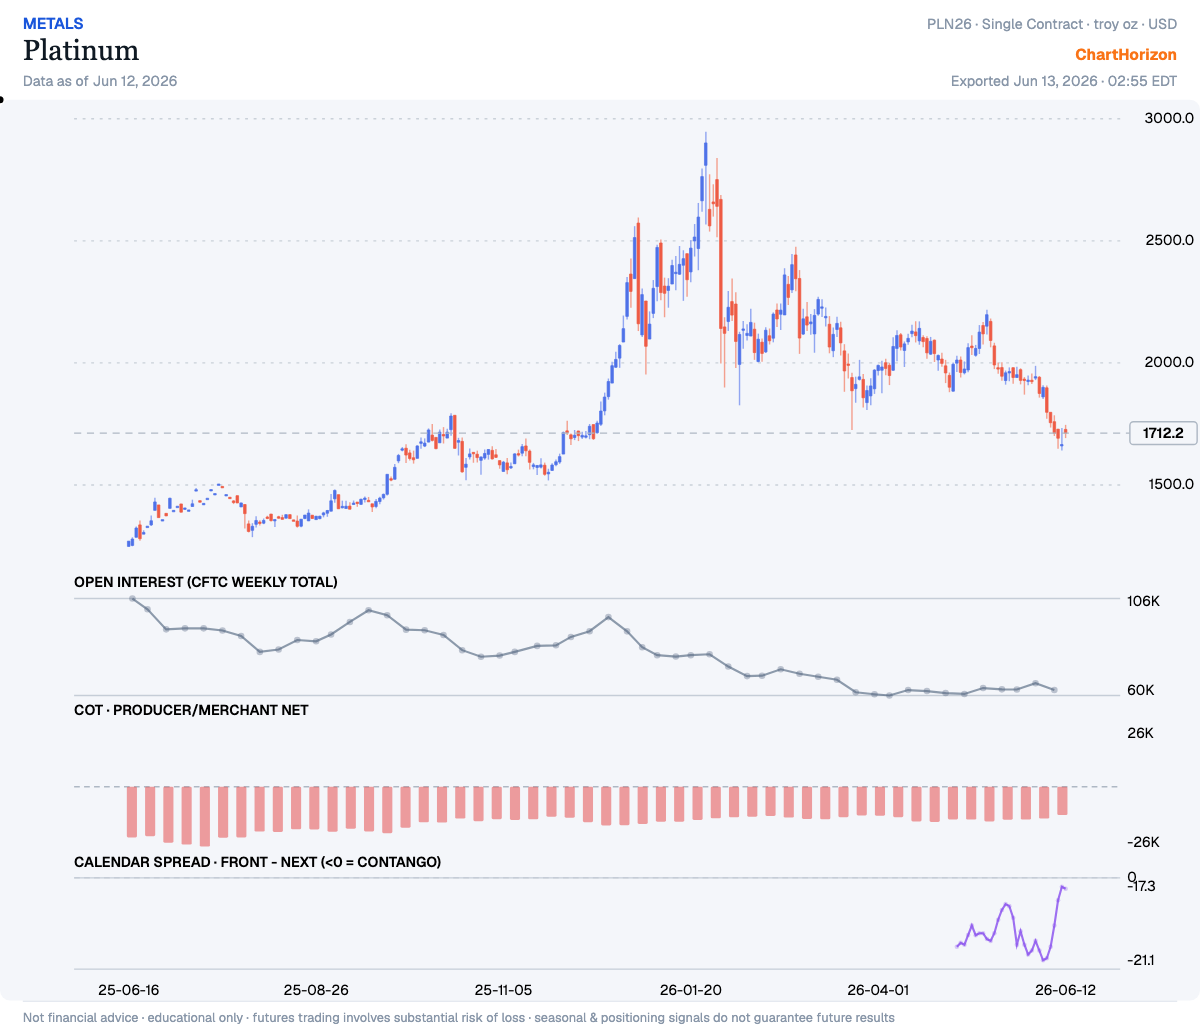
<p><img src="/assets/posts/2026-07-11-hedgers-ledger/cards/platinum.png" alt="Platinum — commercials net positioning" width="1200" height="1036" loading="lazy" /></p>

<p>Producer/Merchant Net sits at the 100th percentile of its ~3-year range — the commercials (hedgers, the “smart-money” side) have been heavy net buyers. That is a fresh record for the window. Net: -9,239 contracts (as of 2026-07-07).</p>

<hr />

<h2 id="silver--commercials-at-a-3-year-high">Silver — commercials at a 3-year HIGH</h2>

<p><img src="/assets/posts/2026-07-11-hedgers-ledger/cards/silver.png" alt="Silver — commercials net positioning" width="1200" height="1036" loading="lazy" /></p>

<p>Producer/Merchant Net sits at the 99th percentile of its ~3-year range — the commercials (hedgers, the “smart-money” side) have been heavy net buyers. Net: -13,356 contracts (as of 2026-07-07). New this week.</p>

<hr />

<h2 id="british-pound--commercials-at-a-3-year-high">British Pound — commercials at a 3-year HIGH</h2>

<p><img src="/assets/posts/2026-07-11-hedgers-ledger/cards/gbp_fx.png" alt="British Pound — commercials net positioning" width="1200" height="1036" loading="lazy" /></p>

<p>Commercial Net sits at the 98th percentile of its ~3-year range — the commercials (hedgers, the “smart-money” side) have been heavy net buyers. Net: +98,366 contracts (as of 2026-07-07).</p>]]></content><author><name>ChartHorizon</name></author><summary type="html"><![CDATA[Weekly COT extremes — where the commercial hedgers sit at the edge of their multi-year positioning range. Data: CFTC via ChartHorizon.]]></summary><media:thumbnail xmlns:media="http://search.yahoo.com/mrss/" url="https://chart-horizon.com/assets/posts/2026-07-11-hedgers-ledger/cards/nzd_fx.png" /><media:content medium="image" url="https://chart-horizon.com/assets/posts/2026-07-11-hedgers-ledger/cards/nzd_fx.png" xmlns:media="http://search.yahoo.com/mrss/" /></entry><entry><title type="html">The Weekly Tape — the bond market’s vote</title><link href="https://chart-horizon.com/2026/06/27/bond-market-vote/" rel="alternate" type="text/html" title="The Weekly Tape — the bond market’s vote" /><published>2026-06-27T00:00:00+00:00</published><updated>2026-06-27T00:00:00+00:00</updated><id>https://chart-horizon.com/2026/06/27/bond-market-vote</id><content type="html" xml:base="https://chart-horizon.com/2026/06/27/bond-market-vote/"><![CDATA[<p>The bond market has cast a vote this week, and the stock indices have not finished counting it. When two arms of the same market disagree, an old tape-reader does not simply side with the louder one — he asks which has been the better judge of what comes next. More often than not, that has been the bond pit.</p>

<h2 id="the-long-end-is-bid">The long end is bid</h2>

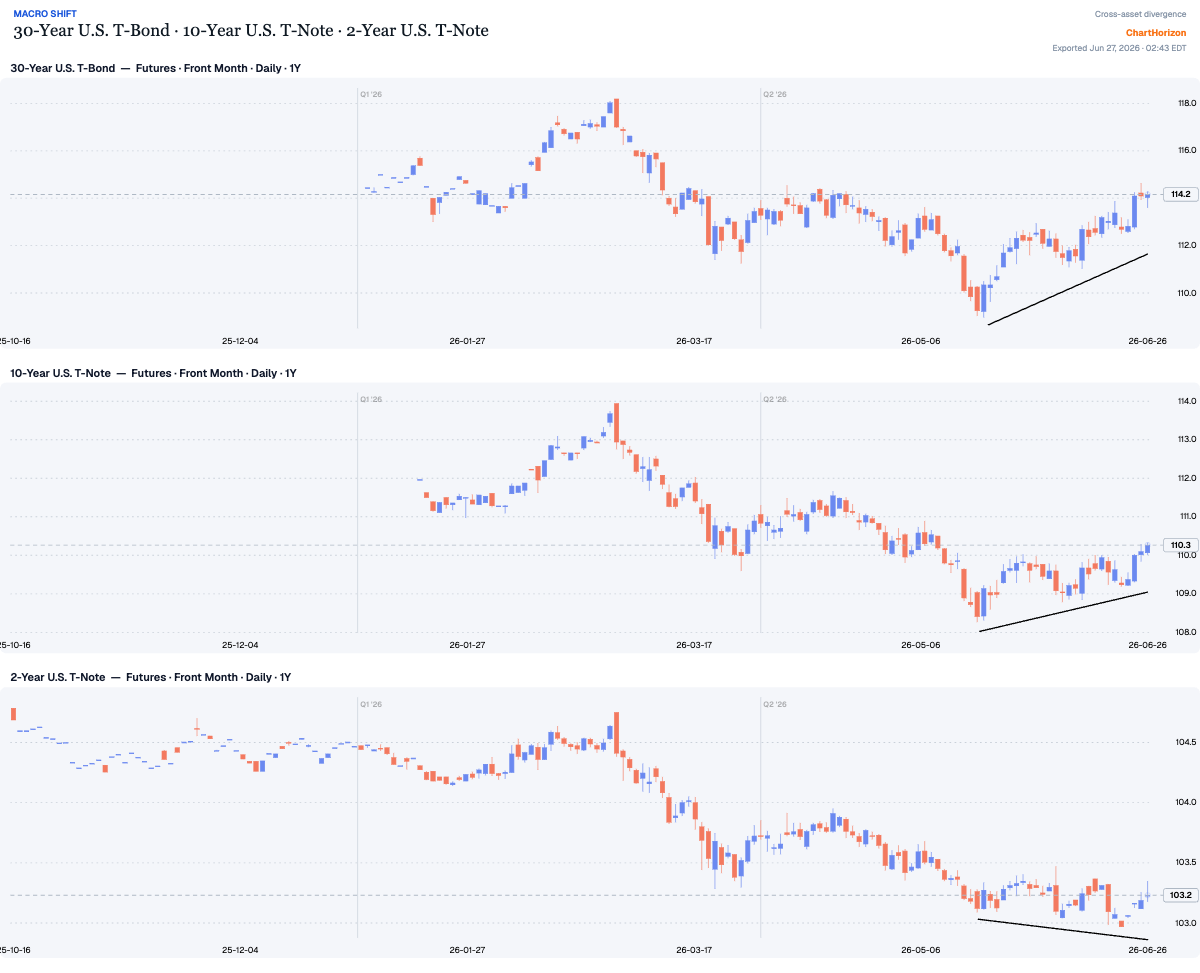
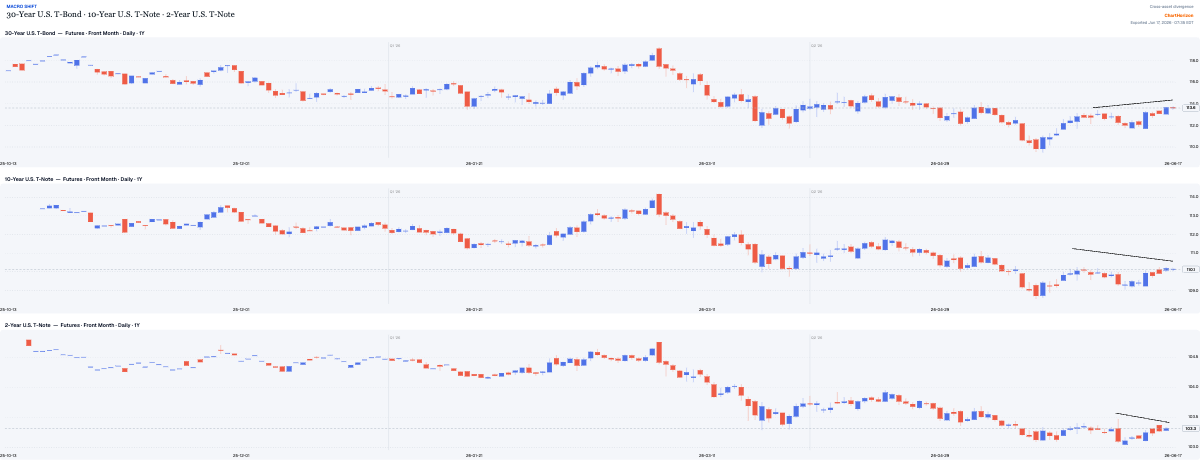
<p>At the long end, money is moving in. The 30-year T-bond has run from 112.47 to 114.16 — up 1.50% in six weeks and pressed to a fresh high on the move — and the 10-year note sits at its own high of the stretch. The 2-year, meanwhile, has barely budged: off 0.13% and going nowhere. That is a bull flattening — the long end rallying while the short end sits still. It is the shape a market makes when it marks down the price of money for the years ahead without any panic about the months right in front of it: no scramble for the front end, no cry for emergency cuts. Lower long rates, calmly arrived at.</p>

<p><img src="/assets/posts/2026-06-27-bond-market-vote/cards/bonds.png" alt="30-Year T-Bond · 10-Year T-Note · 2-Year T-Note — the long end bid, the 2-year still" width="1200" height="973" loading="lazy" /></p>

<h2 id="the-indices-have-not-caught-up--except-one">The indices have not caught up — except one</h2>

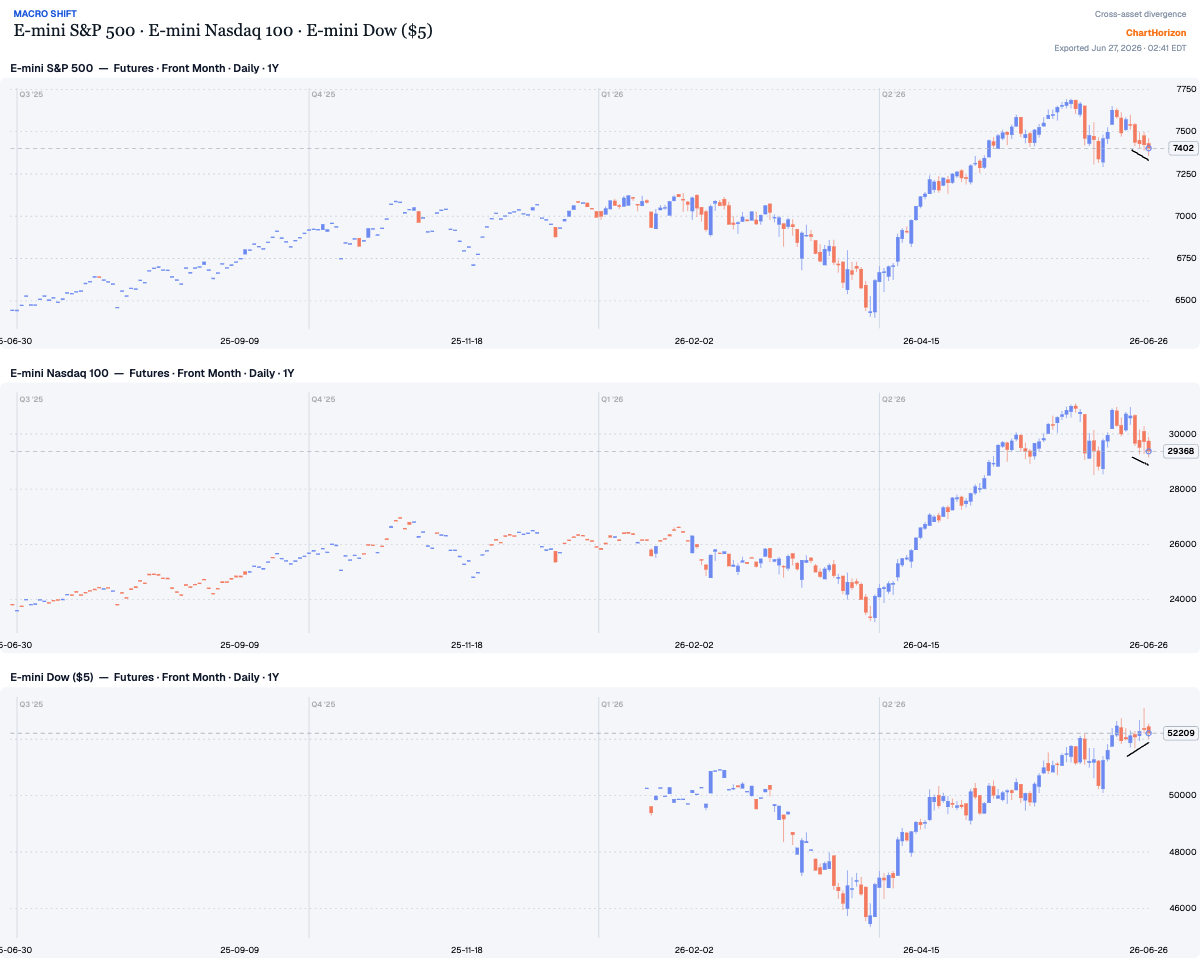
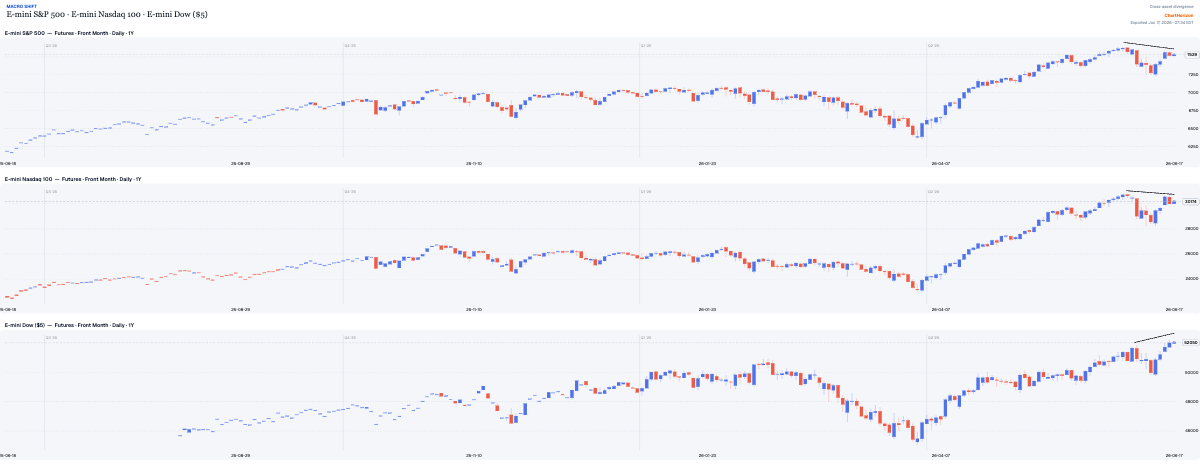
<p>Look across to the equity board and the first thing the eye catches is disagreement. The S&amp;P 500 has slipped 1.64% from its high and the Nasdaq 1.08% — the long-duration names, the very ones that ought to cheer lower discount rates, have been the laggards. But the Dow tells the opposite story: up 4.10% and sitting within a whisker of its high. The cyclical index — the steel, the banks, the machinery — is not retreating. It is leading.</p>

<p><img src="/assets/posts/2026-06-27-bond-market-vote/cards/indices.png" alt="E-mini S&amp;P 500 · E-mini Nasdaq 100 · E-mini Dow — the Dow leading, the others lagging" width="1200" height="973" loading="lazy" /></p>

<h2 id="the-read">The read</h2>

<p>Here is why the Dow matters more than the dip. If the bond rally were a flight to safety — money running ahead of a storm in stocks — the cyclical index would be the first thing thrown overboard, and it would be falling hardest. It is doing the reverse. A market does not bid the bond and the cyclical together out of fear; it does so when it expects easier money and steadier growth at once. The calm 2-year says the same — no one is pricing an emergency. So I read the bond bid as the benign kind, and the soft patch in the S&amp;P and the Nasdaq as a pause in a crowd that has run ahead of itself, not a top.</p>

<p>Two arms of the market, and the one with the longer memory has voted: lower rates, risk on. The line of least resistance for the indices that lagged runs the same way the bonds and the Dow already point — higher. I do not call the day or the hour, and an intermarket lead can fail; a flattening has fronted for trouble before. But the cyclical bid argues against that here, and until the tape says otherwise, I would not care to bet against the bond market’s judgment.</p>]]></content><author><name>ChartHorizon</name></author><summary type="html"><![CDATA[Bonds have voted: the long end is bid to fresh highs while the 2-year sits still — a bull flattening. With the Dow leading and the S&P and Nasdaq merely consolidating, the cross-asset read points risk-on, not to a top.]]></summary><media:thumbnail xmlns:media="http://search.yahoo.com/mrss/" url="https://chart-horizon.com/assets/posts/2026-06-27-bond-market-vote/cards/bonds.png" /><media:content medium="image" url="https://chart-horizon.com/assets/posts/2026-06-27-bond-market-vote/cards/bonds.png" xmlns:media="http://search.yahoo.com/mrss/" /></entry><entry><title type="html">The Hedgers’ Ledger — a note on the dollar</title><link href="https://chart-horizon.com/2026/06/27/hedgers-ledger-dollar/" rel="alternate" type="text/html" title="The Hedgers’ Ledger — a note on the dollar" /><published>2026-06-27T00:00:00+00:00</published><updated>2026-06-27T00:00:00+00:00</updated><id>https://chart-horizon.com/2026/06/27/hedgers-ledger-dollar</id><content type="html" xml:base="https://chart-horizon.com/2026/06/27/hedgers-ledger-dollar/"><![CDATA[<p>The commercials have shown their hand this week, and it points one way: away from the dollar.</p>

<h2 id="the-currencies--hedgers-pressing-long">The currencies — hedgers pressing long</h2>

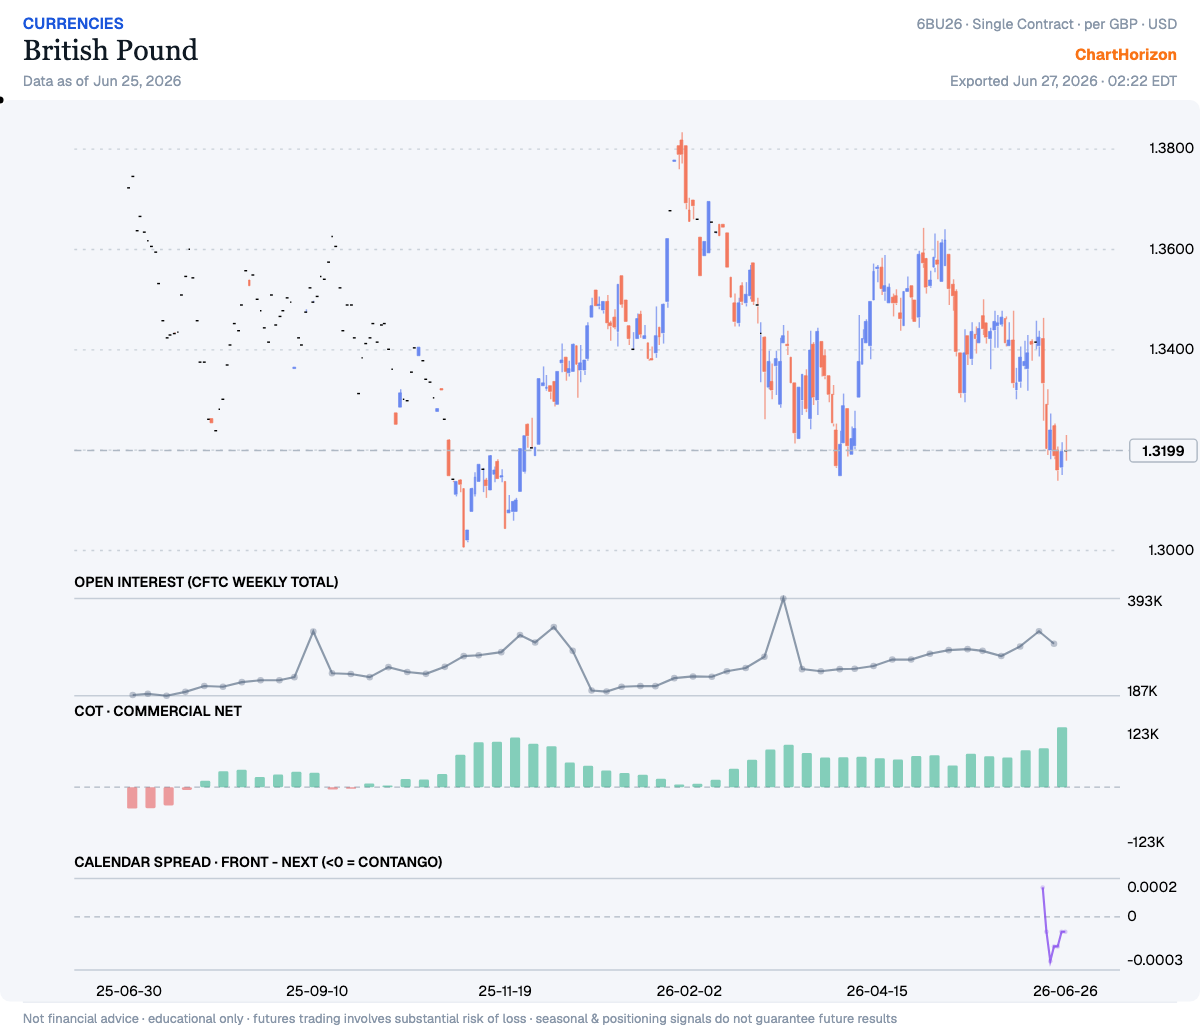
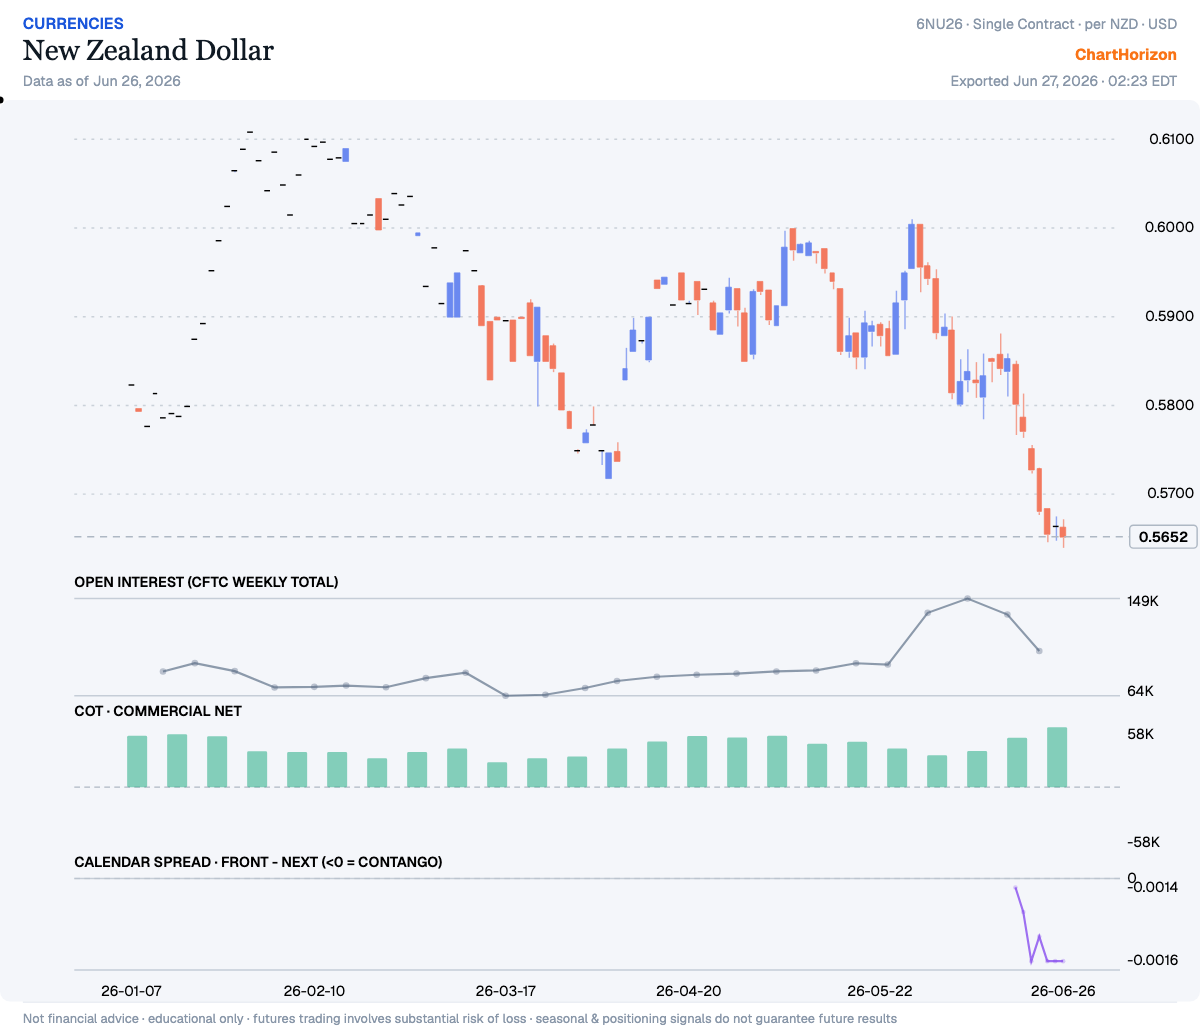
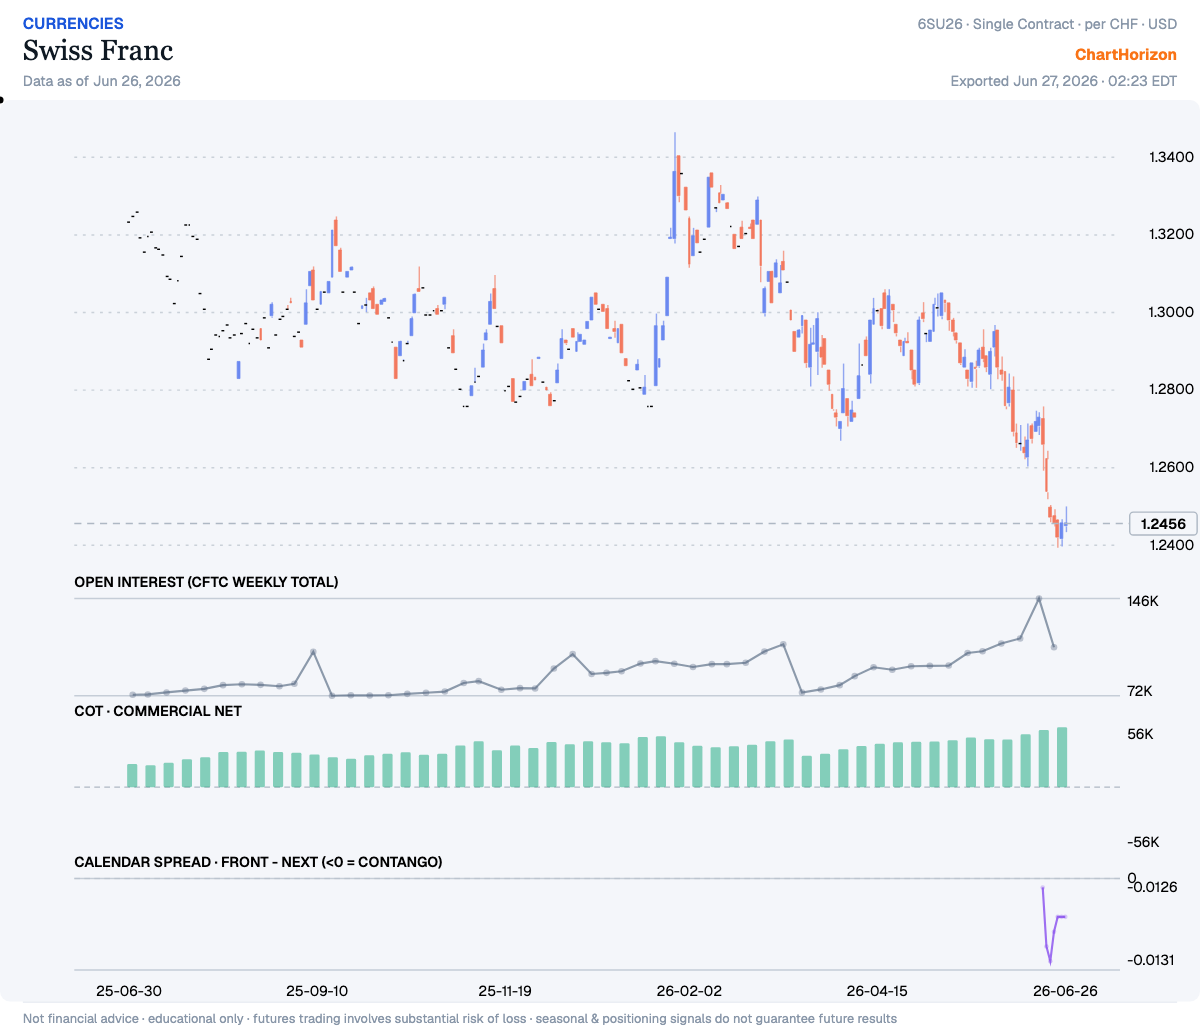
<p>In the currencies the hedgers are not trimming — they are pressing. The commercial book in sterling stands net long 123,431 contracts, up from 79,925 a week ago and a fresh three-year record; the New Zealand dollar (+57,522) and the Swiss franc (+56,495) lean the same way, both stretched further than they have run in years. These are the people who must handle the physical flows, and when they crowd to one side of the boat, an old tape-reader marks which side. Their lean is bullish the currencies — and a bid for the currencies is an offer in the dollar.</p>

<p><img src="/assets/posts/2026-06-27-hedgers-ledger-dollar/cards/gbp_fx.png" alt="British Pound — commercial net long +123,431 (three-year record, vs +79,925 prior week)" width="1200" height="1036" loading="lazy" /></p>

<p><img src="/assets/posts/2026-06-27-hedgers-ledger-dollar/cards/nzd_fx.png" alt="New Zealand Dollar — commercial net long +57,522 (rising)" width="1200" height="1036" loading="lazy" /></p>

<p><img src="/assets/posts/2026-06-27-hedgers-ledger-dollar/cards/chf_fx.png" alt="Swiss Franc — commercial net long +56,495 (rising)" width="1200" height="1036" loading="lazy" /></p>

<h2 id="the-metals--shorts-covered-into-weakness">The metals — shorts covered into weakness</h2>

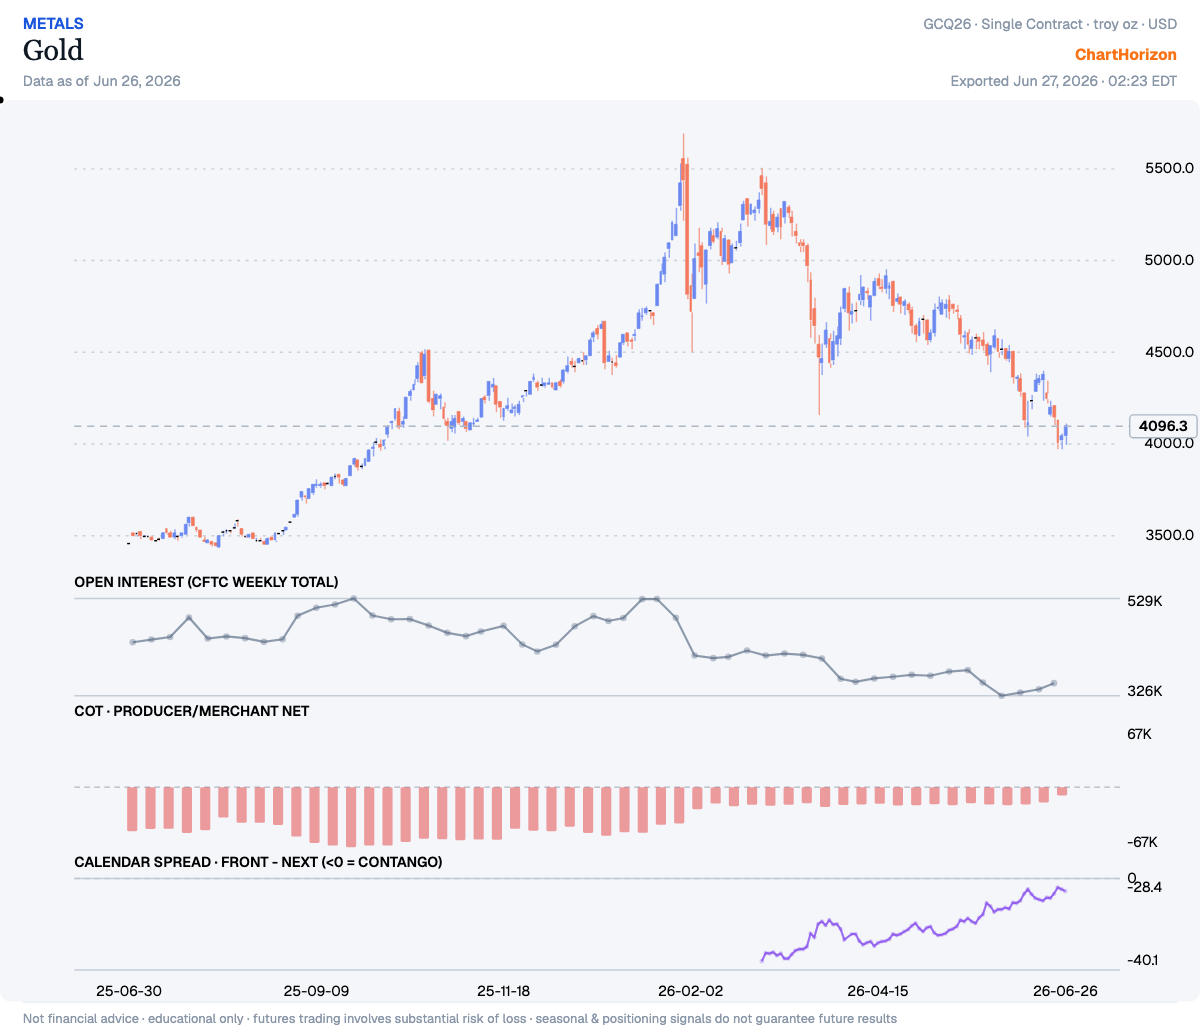
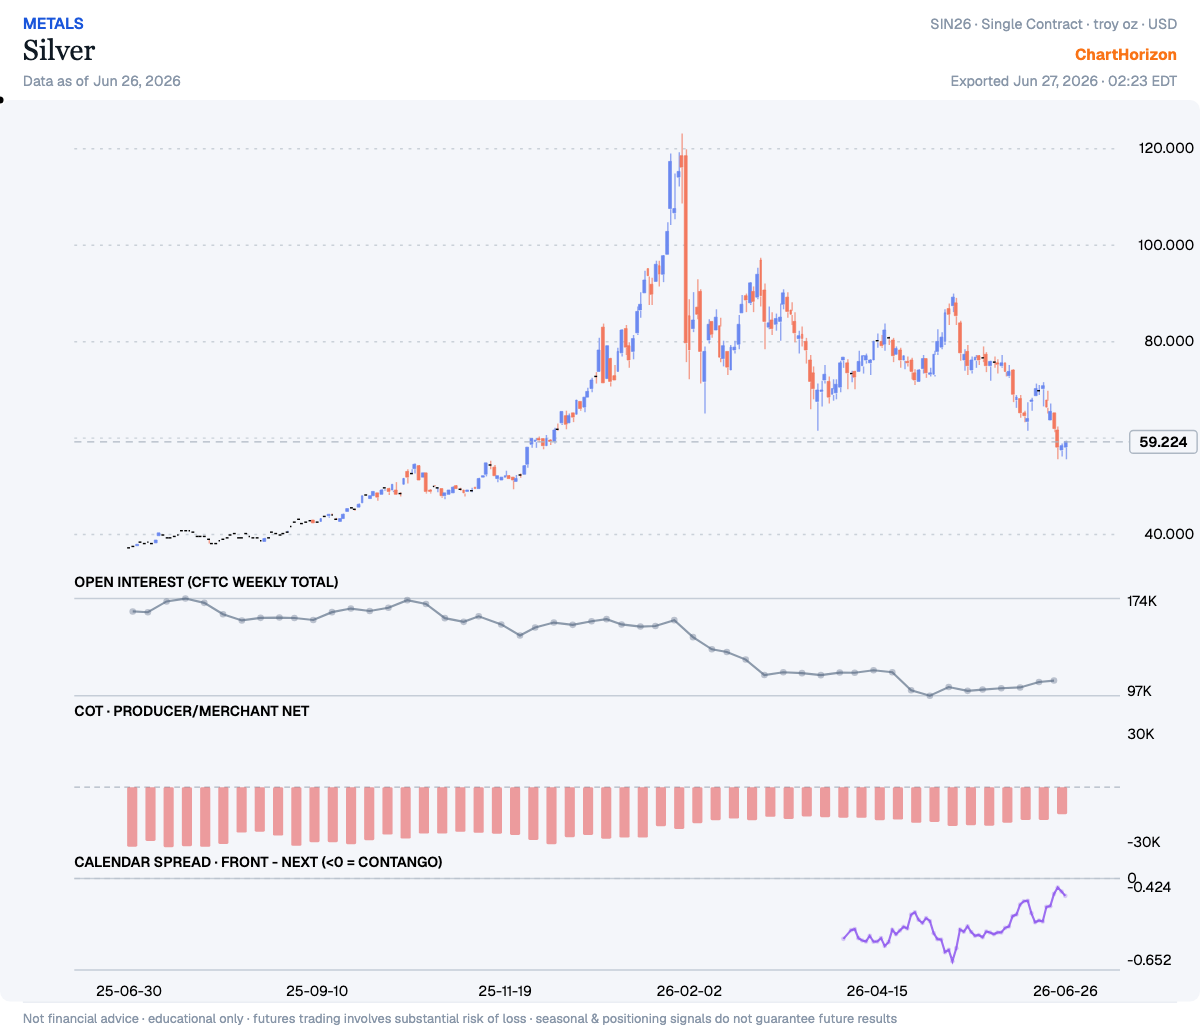
<p>The metals tell the same story from the other end. In gold the commercial net short has been cut nearly in half — from 19,300 contracts to 9,336 — and in silver from better than 16,600 down to 13,722, the shorts bought back week after week even as price fell: gold off better than two hundred dollars, silver back from seventy. Men do not cover into a decline unless they expect the decline to end. The calendar spread confirms the firming — gold’s front-to-next discount narrowed from −30.5 to −29.0, silver’s from −0.53 to −0.45: still a carry, but a carry tightening, not loosening.</p>

<p><img src="/assets/posts/2026-06-27-hedgers-ledger-dollar/cards/gold.png" alt="Gold — commercial net short cut to −9,336 (from −17,047); spread firming −30.5 → −29.0" width="1200" height="1036" loading="lazy" /></p>

<p><img src="/assets/posts/2026-06-27-hedgers-ledger-dollar/cards/silver.png" alt="Silver — commercial net short cut to −13,722; spread firming −0.53 → −0.45" width="1200" height="1036" loading="lazy" /></p>

<h2 id="the-read">The read</h2>

<p>Two markets, one message. The smart money is selling the dollar — long the foreign currencies, covering the metal shorts into weakness. I do not call the day or the hour; extremes can stretch, and the structure is firming, not yet inverted. But the line of least resistance, as the hedgers have drawn it, runs against the dollar. The sitting is the position.</p>]]></content><author><name>ChartHorizon</name></author><summary type="html"><![CDATA[The commercials are positioned against the dollar — extreme net longs in sterling, the kiwi and the franc, and metal shorts covered into weakness. A COT read on a possible dollar correction.]]></summary><media:thumbnail xmlns:media="http://search.yahoo.com/mrss/" url="https://chart-horizon.com/assets/posts/2026-06-27-hedgers-ledger-dollar/cards/gbp_fx.png" /><media:content medium="image" url="https://chart-horizon.com/assets/posts/2026-06-27-hedgers-ledger-dollar/cards/gbp_fx.png" xmlns:media="http://search.yahoo.com/mrss/" /></entry><entry><title type="html">The Tape Answers Back: A Hollow Advance</title><link href="https://chart-horizon.com/2026/06/17/hollow-advance/" rel="alternate" type="text/html" title="The Tape Answers Back: A Hollow Advance" /><published>2026-06-17T00:00:00+00:00</published><updated>2026-06-17T00:00:00+00:00</updated><id>https://chart-horizon.com/2026/06/17/hollow-advance</id><content type="html" xml:base="https://chart-horizon.com/2026/06/17/hollow-advance/"><![CDATA[<p>Last week I leaned with the wind and said so plainly. The dollar had run up to the 100 wall and
stalled, sterling had turned up against it, and the stock leaders were only reacting inside an
advance the heaviest of them never abandoned. The line of least resistance, I wrote, leaned up —
but <em>lean</em> was the word, not lunge, and the whole of that lean rested on one condition I named out
loud: the Dollar Index had to <em>reject</em> the 100 handle and roll off its rising support, sterling
leading it down, before the cap would come off the stock market. That was the proof the bull case
was waiting on. In the sessions since, it has not come. The dollar stalled; it did not break.
Sterling pressed nothing. The one thing that would have signed the risk-on turn never put its name
to the page — and yet the stock leaders went ahead and made their new highs anyway, on a tape that
had not earned them.</p>

<p>That is where a careful reader stops and turns the lamp up. A market that advances without the
confirmation its own logic demanded is not advancing on strength; it is advancing on momentum and
hope, and the two of them together have emptied more accounts than any panic. So I went back over
the board the way I went over it last week — the group first, then the single name — and I found
not one missing vote but three. The stock leaders no longer agree with each other. The bond board
no longer agrees with itself. And the Dow, the very name that led the advance, no longer agrees
with its own term structure. Three divergences, all pointing the same way. The climb is hollow.</p>

<hr />

<h2 id="the-leaders-make-price-not-strength">The leaders make price, not strength</h2>

<p><img src="/assets/posts/2026-06-17-hollow-advance/cards/equities.png" alt="Macro Shift — E-mini S&amp;P 500, Nasdaq 100 and Dow: the S&amp;P and Nasdaq carve lower highs under descending lines while only the Dow presses to a new high" width="1200" height="467" loading="lazy" /></p>

<p>A healthy advance is signed by every leader at once — that was the whole virtue of the move off
the April low, straight and broad and undersigned by none. Look at the three now and the signatures
have begun to thin. The S&amp;P 500 at 7529 has made a lower high and turned down beneath a descending
line drawn over the very top. The Nasdaq 100 near 30,100 has done the same — the fast money’s index,
the one that ought to lead a true risk-on charge, instead rolling over first under its own
descending line. Only the Dow, near 52,000, has pressed on to a marginal new high, and it now stands
very nearly alone in doing so.</p>

<p>The crowd reads that new high in the Dow as strength. I read it as narrowing. When the broad index
and the growth index both make lower highs while the heaviest, slowest name carries the tape up by
itself, the advance is not being confirmed — it is being <em>carried</em>, on fewer and fewer shoulders.
New highs made by one leader while the others quit is the oldest tell of distribution there is: the
averages diverge at the top because the buying that built the move has begun, quietly, to become
selling. A top is not a moment; it is a process, and this is what the early part of the process
looks like on the tape.</p>

<hr />

<h2 id="the-bond-board-stops-agreeing">The bond board stops agreeing</h2>

<p><img src="/assets/posts/2026-06-17-hollow-advance/cards/bonds.png" alt="Macro Shift — 30-Year T-Bond, 10-Year T-Note and 2-Year T-Note: the long bond turns up on a rising line while the 10- and 2-year slip under descending lines" width="1200" height="467" loading="lazy" /></p>

<p>Read the bond board the same way — the group, not the single quote — and it is telling a story the
stock crowd is not yet listening to. These three maturities normally move as one family. Here they
have split. The 30-year T-Bond, near 93.8, has stopped falling and <em>turned up</em>, climbing a rising
line drawn under its recent lows. The 10-year, near 110.3, and the 2-year, near 103.0, have done
the opposite — each slipping beneath a descending line over its highs. The long end is being bid
while the front and the belly are sold.</p>

<p>Now, the long bond is the market’s truest instrument of fear — the thing money runs to when it
begins to doubt the future and to want duration and safety in its hands. For that instrument to be
quietly accumulated <em>while stocks make new highs</em> is two markets telling two different stories at
the same hour, and when they disagree it is usually the bond market that has read the next chapter
first. A bid for protection rising under the surface does not belong beneath a healthy risk-on
advance. It belongs beneath a tape that is preparing, in its slow underground way, to go the other
direction. The bond board has begun to whisper risk-<em>off</em> while the stock board still shouts
risk-on — and I have learned to trust the whisper.</p>

<hr />

<h2 id="the-dows-own-confession">The Dow’s own confession</h2>

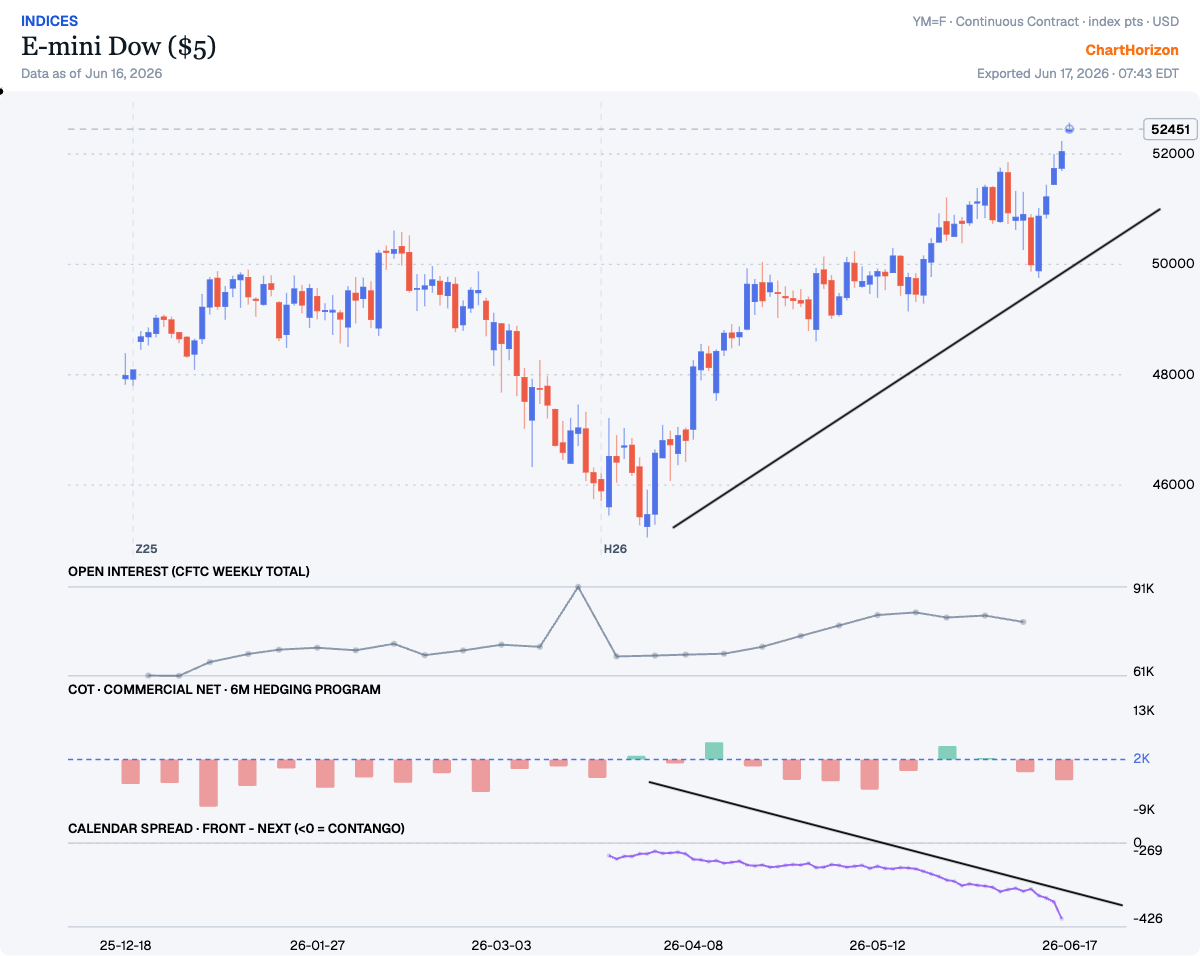
<p><img src="/assets/posts/2026-06-17-hollow-advance/cards/dow.png" alt="E-mini Dow — price rides a steep rising line to a new high near 52,451 while the calendar spread deepens into contango toward −426 beneath it" width="1200" height="956" loading="lazy" /></p>

<p>Then take the leader itself — the one name still making new highs, the Dow at 52,451 — and put its
own internals beneath its own price, and you find it confessing against itself. The price rides a
steep rising line straight up off the H26 low, as clean a trend as the board offers. But drop to
the bottom pane, to the calendar spread — front month minus next, where anything below zero is
contango — and you see it doing the exact reverse: deepening from around −269 down to −426, a
descending line falling away beneath a price that is climbing. That is the divergence that matters
most, because it comes not from a chart I drew a line on but from the structure of the contract
itself.</p>

<p>A rising price with a deepening contango is a market making new highs while the men who must
actually carry the position grow <em>less</em> willing to pay up for the here-and-now and <em>more</em> content to
let the front month sag against the deferred. The urgency is draining out of the very contract that
is printing the high. Glance up one pane and the rest agrees: open interest has rolled off its 91K
spike and drifted, no fresh crowd rushing in to power the breakout; the commercials — the hedgers,
the people who handle the real thing — sit net short into the advance, as the red of the program
plainly shows. New high in price, falling spread, flat-to-easing interest, hedgers leaning the other
way. The tape is making its high with one hand and selling it with the other. This is the advance
the market will not sign — and an unsigned advance is, as often as not, a fake one.</p>

<hr />

<h2 id="the-read--sell-the-break-not-the-high">The read — sell the break, not the high</h2>

<p>Put the three together and the verdict is harder than last week’s, because the condition I set last
week was never met and the evidence has since piled the other way. The dollar never broke, so the
bull case never earned its confirmation; the leaders have stopped confirming each other; the bond
board is bidding for safety under the surface; and the Dow is making its high on a hollowing
structure with the hedgers selling into it. I do not believe this advance. I think the late buying
is the public’s, the late selling is the smart hand’s, and the new high is the bait on the hook.</p>

<p>But understand the discipline, because the discipline is the whole of the edge. A divergence is a
<em>warning</em>, not a <em>signal</em>. I do not short a market merely because it has diverged — to sell a strong
tape short on a hunch is the same blunder as buying a weak one on hope, worn inside out, and the
market has stayed irrational longer than that error can stay solvent. The market is never wrong; my
reasons can be. So I will not short the high. I will short the <em>break</em> — and I will let the tape
hand it to me. The pivotal points are drawn already and they are simple: the Dow’s steep rising line
and the reaction lows beneath this whole top; the S&amp;P and Nasdaq, which have only to extend the
lower highs they have started; and above all the dollar, whose <em>failure</em> to break is the cap holding
firm, so that the day the leaders give way the wind itself reverses. Let the rising lines give. Let
the Dow lose the trend it is riding and the others lose their floors. <em>Then</em> the divergence becomes a
trend, the warning becomes a position, and the line of least resistance points down — and I will
sit on the short side with the wind at my back the same way I sat on the long.</p>

<p>Until that hour, the position to hold is cash, and cash is a position — frequently the strongest one
on the table. The hollow advance may yet make another high; hollow things often do, right up until
the floor goes. I am not selling the high and I am not buying it. I am standing flat with the lines
marked, waiting for the tape to stop confessing and start <em>confirming</em> — and the way every part of
this board is leaning, I do not think the wait will be a long one.</p>]]></content><author><name>ChartHorizon</name></author><summary type="html"><![CDATA[The stock leaders print new highs without the dollar weakness the bull case required, while bond-board and Dow calendar-spread divergences warn of risk-off. A Livermore-voice read of a possible top, June 17, 2026.]]></summary><media:thumbnail xmlns:media="http://search.yahoo.com/mrss/" url="https://chart-horizon.com/assets/posts/2026-06-17-hollow-advance/cards/dow.png" /><media:content medium="image" url="https://chart-horizon.com/assets/posts/2026-06-17-hollow-advance/cards/dow.png" xmlns:media="http://search.yahoo.com/mrss/" /></entry><entry><title type="html">The Weekly Tape — The Dollar at the 100 Line</title><link href="https://chart-horizon.com/2026/06/14/weekly-tape/" rel="alternate" type="text/html" title="The Weekly Tape — The Dollar at the 100 Line" /><published>2026-06-14T00:00:00+00:00</published><updated>2026-06-14T00:00:00+00:00</updated><id>https://chart-horizon.com/2026/06/14/weekly-tape</id><content type="html" xml:base="https://chart-horizon.com/2026/06/14/weekly-tape/"><![CDATA[<p>A man does not read one market in a corner; he sizes up the whole board first, then trades the
single name. Read the group, not the lone quote — and the group this week leans on one hinge. The
Dollar Index, the euro and the pound sit on one card; the three stock leaders sit on the other;
and they are telling the same story from two directions. The dollar has run up to a wall. Where
the dollar stops, the stock market is handed room to breathe — and that, in the modern tongue, is
the whole of a “risk-on” read: nothing but the old language for general conditions turning
friendly.</p>

<hr />

<h2 id="the-dollar--pressed-to-100-and-stalling">The dollar — pressed to 100, and stalling</h2>

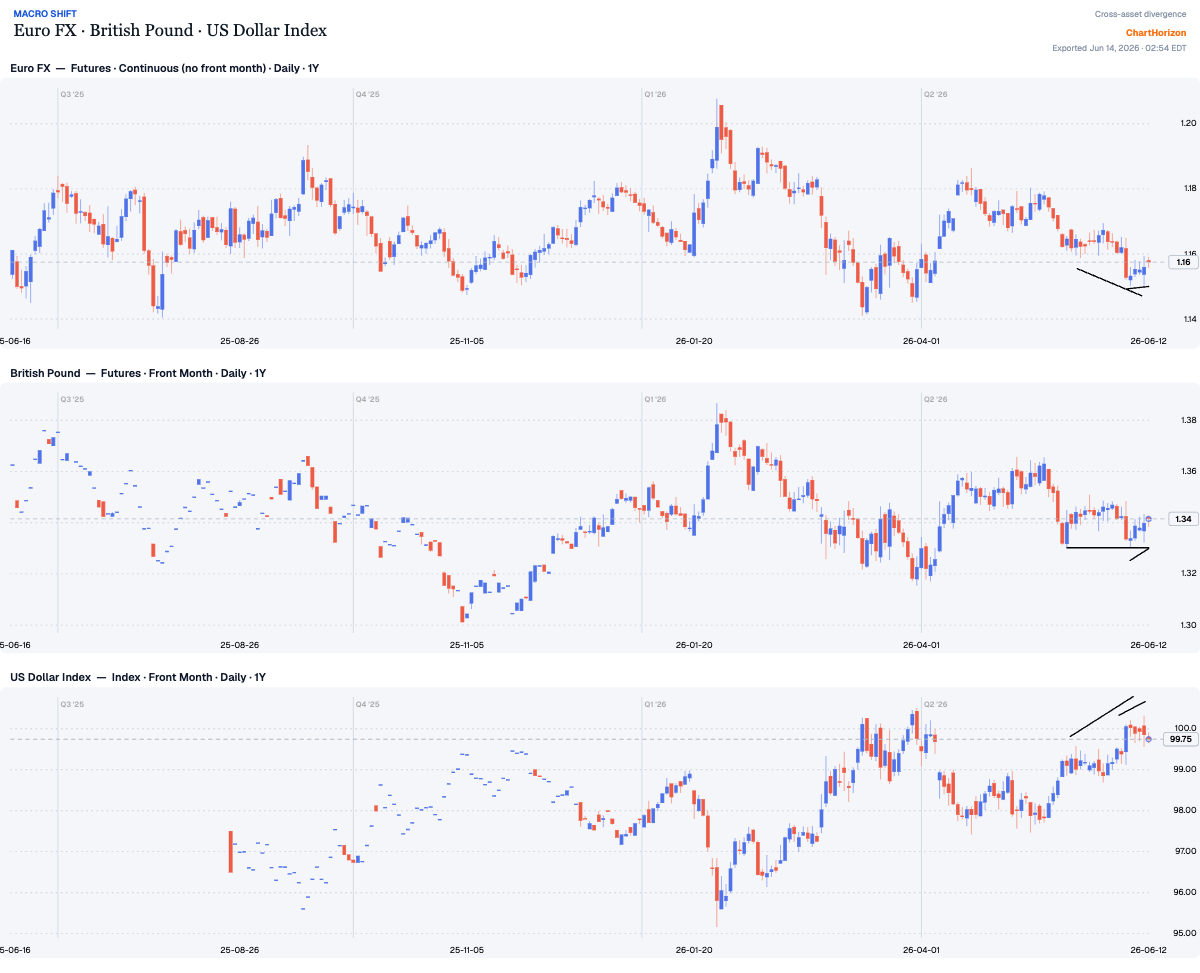
<p><img src="/assets/posts/2026-06-14-weekly-tape/cards/fx.png" alt="Macro Shift — Euro FX, British Pound and the US Dollar Index: the dollar stalls at the 100 handle while sterling turns up" width="1200" height="973" loading="lazy" /></p>

<p>The Dollar Index carried up from its spring low along a clean rising line and has now arrived
where round numbers live — the 100 handle at 99.75, the very ceiling that turned it back earlier
in the year. And here, at the top of the run, it has printed its first red candle off the high.
That is not yet a break of the rising line; it is the first hesitation, the tape pausing at
exactly the level a careful reader expects it to pause.</p>

<p>And within the currencies themselves there is a clear leader — it is the pound. The euro offers
the bull nothing: at 1.16 it still grinds out lower highs beneath its own descending line, the
weakest of the group and proof the dollar’s bid is not yet dead. But sterling is the strong
sister. At 1.34 it has <em>stopped going down</em>, turning up off a line drawn beneath its recent lows
while the euro sags — the most bullish foreign currency on the board, the one already leaning
against the dollar before the dollar has even confirmed its own stall. Read the group, not the
single quote: when the strongest currency turns up first, it usually leads the rest, and a dollar
pinned at a round-number wall by a <em>rising</em> pound is a dollar the tape has begun to question.</p>

<p>The discipline here is plain. The rising line is not broken; the dollar has stalled, not turned. A
pivotal point is the spot where a move of importance begins, and this is that spot — but the spot
is not the proof. I want to see the 100 handle reject and the rising support give way, with
sterling pressing its lead, before I trade the turn instead of anticipating it.</p>

<hr />

<h2 id="the-stock-leaders--a-reaction-not-a-top">The stock leaders — a reaction, not a top</h2>

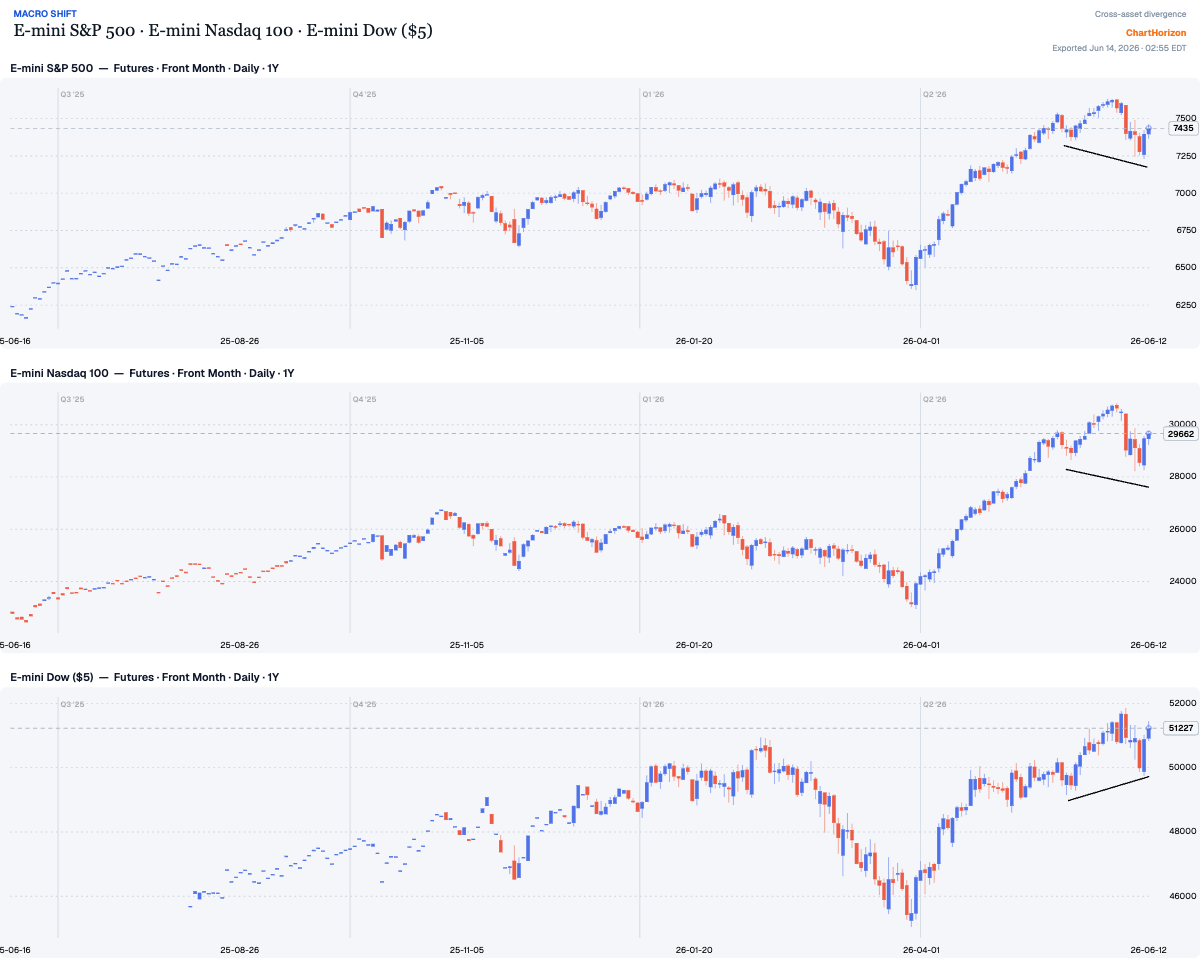
<p><img src="/assets/posts/2026-06-14-weekly-tape/cards/equities.png" alt="Macro Shift — E-mini S&amp;P 500, Nasdaq 100 and Dow: a reaction inside the advance, with the Dow holding its trend" width="1200" height="973" loading="lazy" /></p>

<p>While the dollar climbed toward 100, the stock leaders did the mirror thing — they quit advancing
and pulled back. The S&amp;P 500 at 7435 and the Nasdaq 100 at 29,662 have each carved a short string
of lower highs, descending lines drawn over the reaction. But weigh <em>what kind</em> of pullback this
is. The advance that ran from the April low into early summer was a powerful one — straight,
broad, signed by every index — and what has followed is a reaction inside that advance, not a
break of it. The proof sits in the third panel: the Dow, the heaviest and slowest of the three,
never broke its rising line at all. At 51,227 it holds its uptrend while the faster names cool —
and a leader that refuses to break while the rest pull back is the tape’s quiet vote that the
larger move is still up.</p>

<p>When the strongest name in a group holds its trend through a reaction, the weakness in the others
is usually a pause, not a peak. The lower highs in the S&amp;P and Nasdaq are the descending lines to
clear; the Dow’s rising line is the floor that says the bull is only resting.</p>

<hr />

<h2 id="the-read--a-friendlier-tape-into-the-week">The read — a friendlier tape into the week</h2>

<p>Put the two cards together and the same fact stares back from each: the strongest name in every
group is already voting bullish. Among the currencies it is the pound, turning up against the
dollar while the euro still sags; among the stocks it is the Dow, holding its rising line while
the S&amp;P and Nasdaq cool. Two leaders, one message. For the short run, then, the line of least
resistance leans up. The dollar is stalled at the one level that matters, its strongest
counterweight has not only stopped falling but started to rise, and the stock leaders are reacting
within an advance the heaviest of them never abandoned. If the Dollar Index rejects the 100 line
and rolls off its rising support — sterling leading it down — the cap comes off the stock market,
and the reaction in the S&amp;P and Nasdaq can resolve the way the Dow has been hinting all along:
back up. That is the modern “risk-on” tilt, which is only the old name for general conditions
turning friendly. When the haven is offered and the leaders are bid, the whole board leans toward
the trade with the wind — and the wind, for the week ahead, leans bullish.</p>

<p>But <em>lean</em> is the word, not lunge. Nothing here is confirmed yet. The dollar’s rising line still
holds; the stocks’ descending lines are not yet cleared. The honest play is to let the tape sign
the turn it is so far only sketching — watch the pound press its lead and the Dollar Index fail
the 100 handle, watch the S&amp;P and Nasdaq take out their reaction highs and rejoin the Dow above
their lines. Anticipate nothing; weigh everything. The big money is never in the guessing. It is
in waiting for the pivot to prove itself, then sitting with the trade once it has.</p>]]></content><author><name>ChartHorizon</name></author><summary type="html"><![CDATA[The Dollar Index stalls at the 100 handle while sterling turns up and the stock leaders hold their advance — a short-term risk-on read for the week ahead. Intermarket notes, June 14, 2026.]]></summary><media:thumbnail xmlns:media="http://search.yahoo.com/mrss/" url="https://chart-horizon.com/assets/posts/2026-06-14-weekly-tape/cards/fx.png" /><media:content medium="image" url="https://chart-horizon.com/assets/posts/2026-06-14-weekly-tape/cards/fx.png" xmlns:media="http://search.yahoo.com/mrss/" /></entry><entry><title type="html">The Hedgers’ Ledger — 2026-06-13</title><link href="https://chart-horizon.com/2026/06/13/hedgers-ledger/" rel="alternate" type="text/html" title="The Hedgers’ Ledger — 2026-06-13" /><published>2026-06-13T00:00:00+00:00</published><updated>2026-06-13T00:00:00+00:00</updated><id>https://chart-horizon.com/2026/06/13/hedgers-ledger</id><content type="html" xml:base="https://chart-horizon.com/2026/06/13/hedgers-ledger/"><![CDATA[<p>The board dated 2026-06-09 runs six markets at positioning highs against two at lows, a lopsided ledger that leans heavily to the long side of the hedger book. Platinum and Brent Crude Oil set fresh records within their three-year windows — one at the top, one at the bottom — which is itself worth marking. Bitcoin enters the tally for the first time, though the extreme there belongs to leveraged funds, a speculative cohort, not the commercial hedgers who anchor most of this report. When six markets crowd the upper rail of their ranges and only two sit at the lower, the tape is telling you something about where the weight of conviction has settled; the prudent reader notes it and waits to see whether price confirms the position.</p>

<table>
  <thead>
    <tr>
      <th>Market</th>
      <th>Side</th>
      <th>Percentile</th>
      <th>New</th>
    </tr>
  </thead>
  <tbody>
    <tr>
      <td>Platinum</td>
      <td><span class="mark-bull">▲ HIGH</span></td>
      <td>100th</td>
      <td> </td>
    </tr>
    <tr>
      <td>Brent Crude Oil</td>
      <td><span class="mark-bear">▼ LOW</span></td>
      <td>1st</td>
      <td> </td>
    </tr>
    <tr>
      <td>Coffee (Arabica)</td>
      <td><span class="mark-bull">▲ HIGH</span></td>
      <td>99th</td>
      <td> </td>
    </tr>
    <tr>
      <td>WTI Crude Oil</td>
      <td><span class="mark-bull">▲ HIGH</span></td>
      <td>99th</td>
      <td> </td>
    </tr>
    <tr>
      <td>Bitcoin</td>
      <td><span class="mark-bull">▲ HIGH</span></td>
      <td>97th</td>
      <td>New</td>
    </tr>
    <tr>
      <td>Copper</td>
      <td><span class="mark-bear">▼ LOW</span></td>
      <td>3rd</td>
      <td> </td>
    </tr>
    <tr>
      <td>10-Year U.S. T-Note</td>
      <td><span class="mark-bull">▲ HIGH</span></td>
      <td>96th</td>
      <td> </td>
    </tr>
    <tr>
      <td>British Pound</td>
      <td><span class="mark-bull">▲ HIGH</span></td>
      <td>96th</td>
      <td> </td>
    </tr>
  </tbody>
</table>

<hr />

<h2 id="platinum--commercials-at-a-3-year-high-fresh-record">Platinum — commercials at a 3-year HIGH (fresh record)</h2>

<p><img src="/assets/posts/2026-06-13-hedgers-ledger/cards/platinum.png" alt="Platinum — commercials net positioning" width="1200" height="1035" loading="lazy" /></p>

<p>Producer/Merchant Net sits at the 100th percentile of its ~3-year range — the commercials (hedgers, the “smart-money” side) have been heavy net buyers. That is a fresh record for the window. Net: -12,284 contracts (as of 2026-06-09).</p>

<hr />

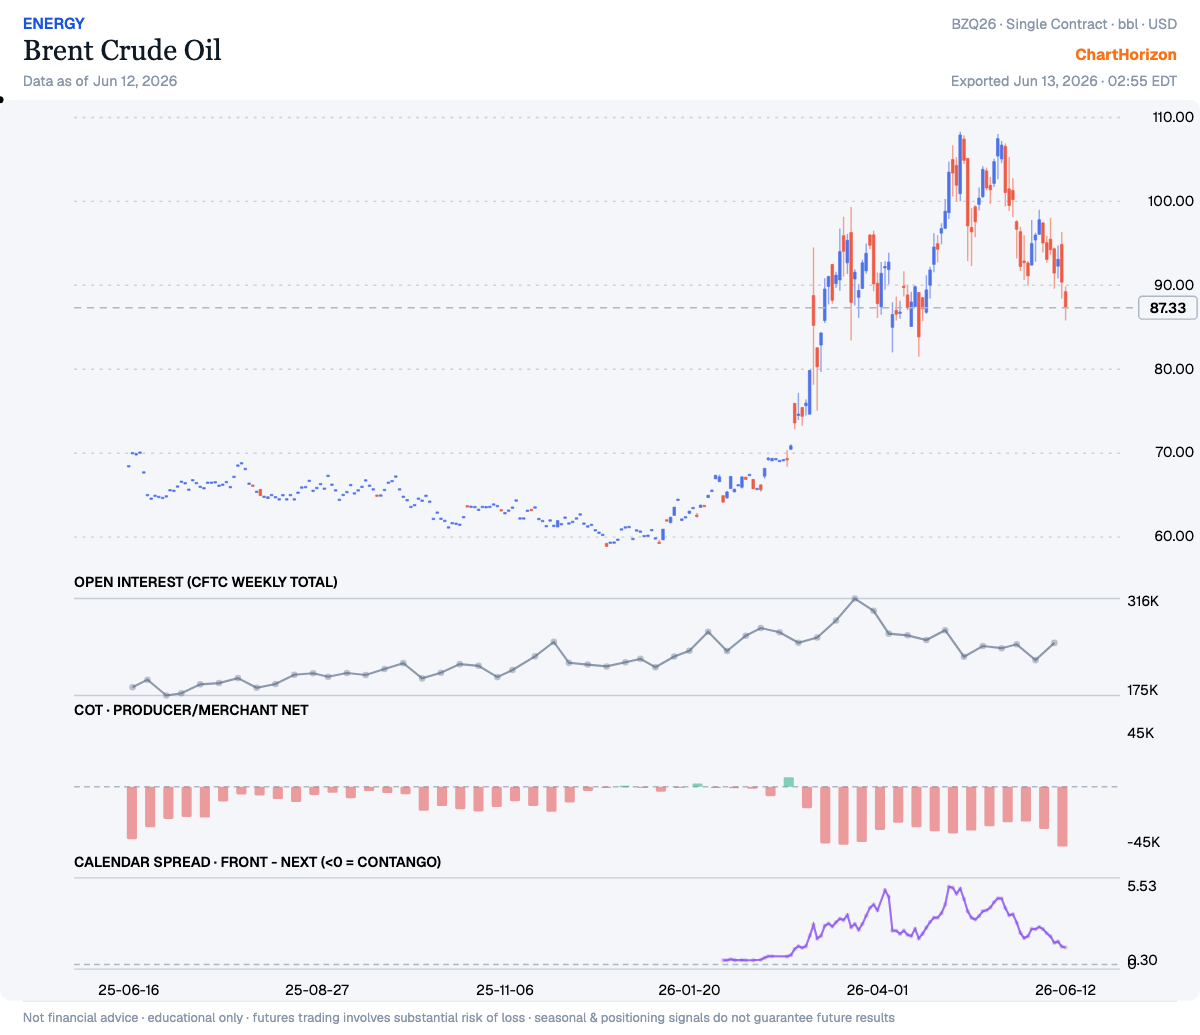
<h2 id="brent-crude-oil--commercials-at-a-3-year-low-fresh-record">Brent Crude Oil — commercials at a 3-year LOW (fresh record)</h2>

<p><img src="/assets/posts/2026-06-13-hedgers-ledger/cards/brent_crude.png" alt="Brent Crude Oil — commercials net positioning" width="1200" height="1035" loading="lazy" /></p>

<p>Producer/Merchant Net sits at the 1st percentile of its ~3-year range — the commercials (hedgers, the “smart-money” side) have been heavy net sellers. That is a fresh record for the window. Net: -44,512 contracts (as of 2026-06-09).</p>

<hr />

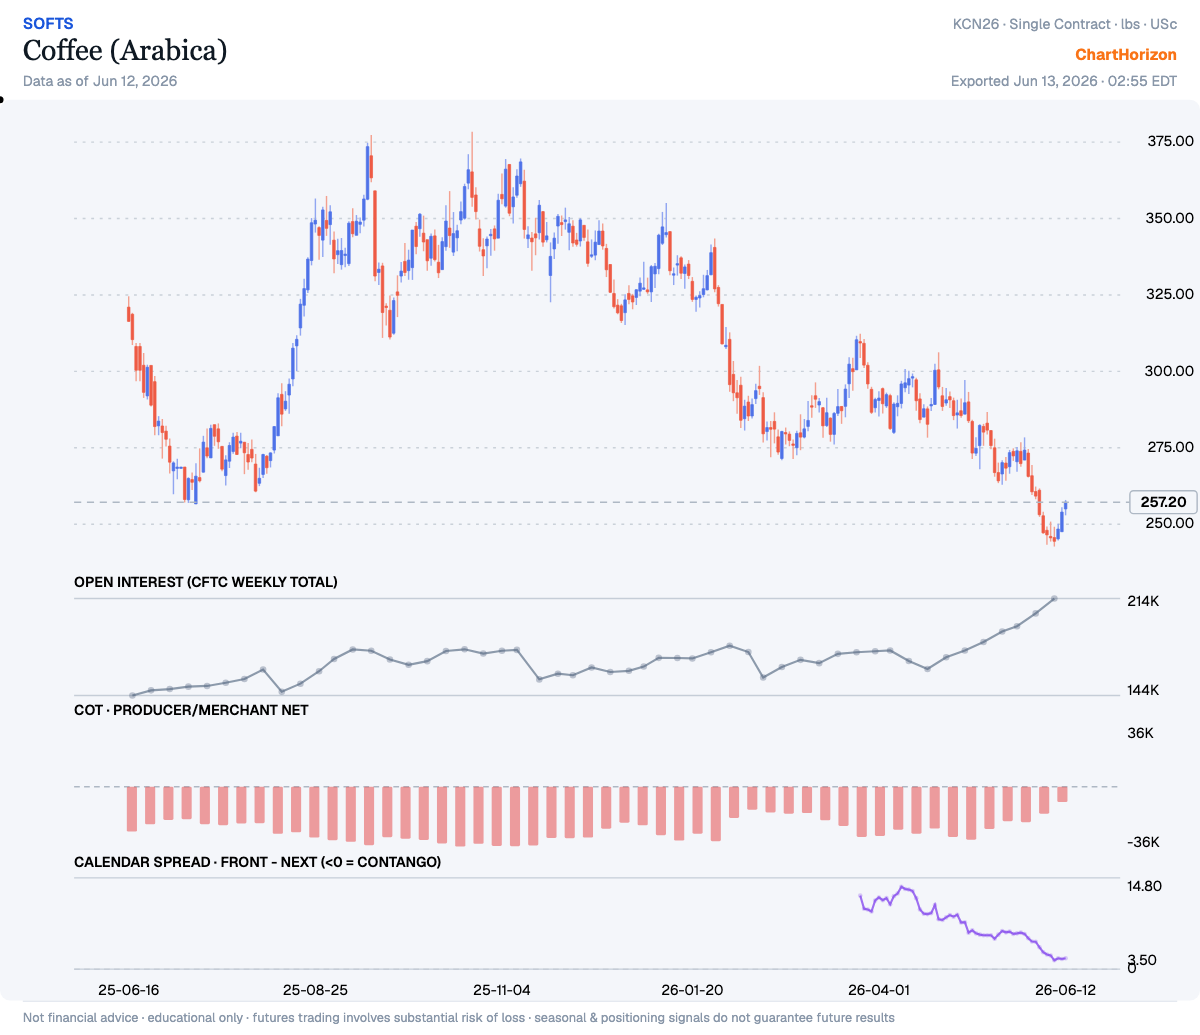
<h2 id="coffee-arabica--commercials-at-a-3-year-high">Coffee (Arabica) — commercials at a 3-year HIGH</h2>

<p><img src="/assets/posts/2026-06-13-hedgers-ledger/cards/coffee.png" alt="Coffee (Arabica) — commercials net positioning" width="1200" height="1035" loading="lazy" /></p>

<p>Producer/Merchant Net sits at the 99th percentile of its ~3-year range — the commercials (hedgers, the “smart-money” side) have been heavy net buyers. Net: -9,308 contracts (as of 2026-06-09).</p>

<hr />

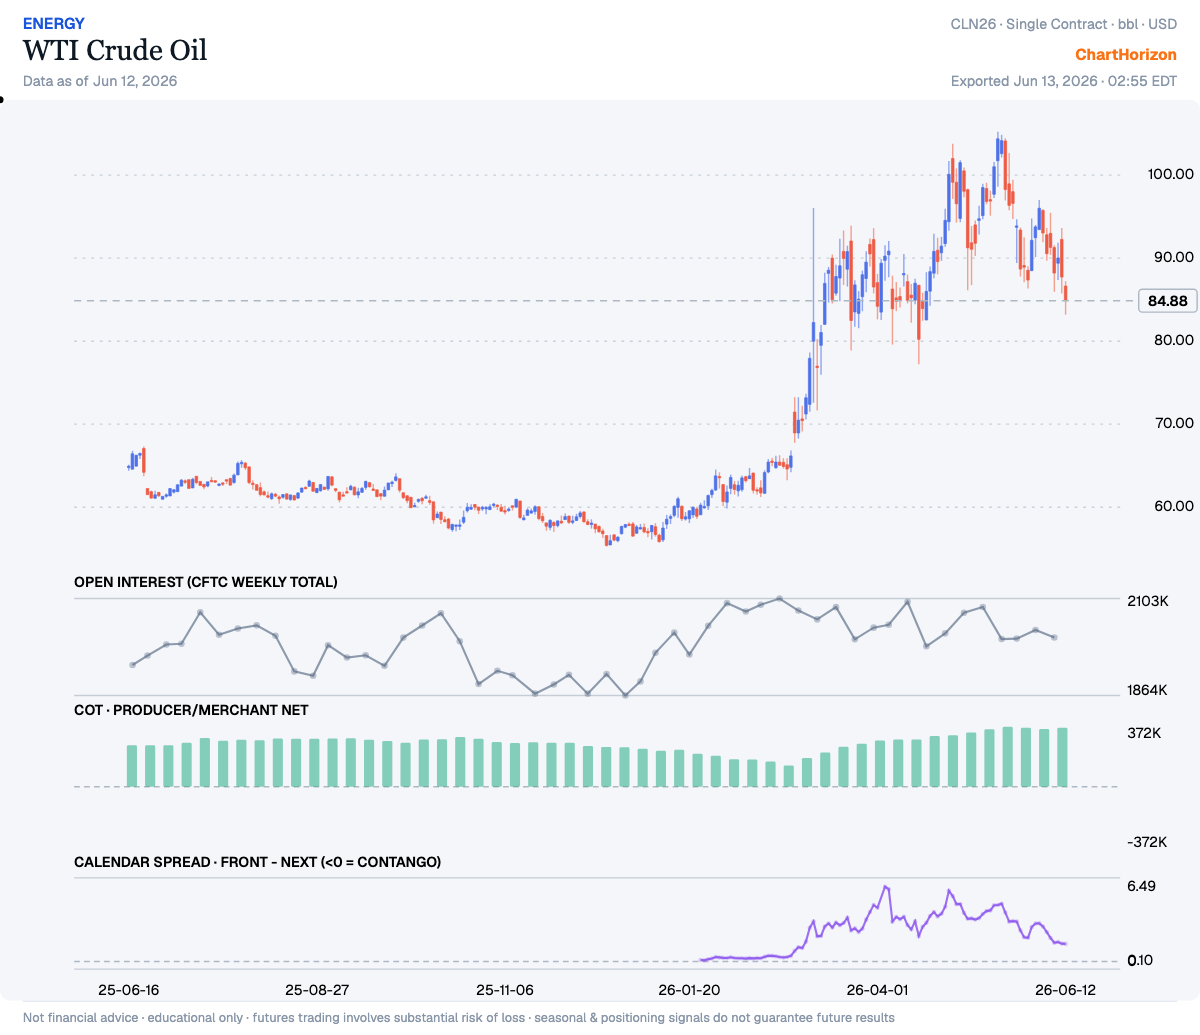
<h2 id="wti-crude-oil--commercials-at-a-3-year-high">WTI Crude Oil — commercials at a 3-year HIGH</h2>

<p><img src="/assets/posts/2026-06-13-hedgers-ledger/cards/wti_crude.png" alt="WTI Crude Oil — commercials net positioning" width="1200" height="1035" loading="lazy" /></p>

<p>Producer/Merchant Net sits at the 99th percentile of its ~3-year range — the commercials (hedgers, the “smart-money” side) have been heavy net buyers. Net: +365,942 contracts (as of 2026-06-09).</p>

<hr />

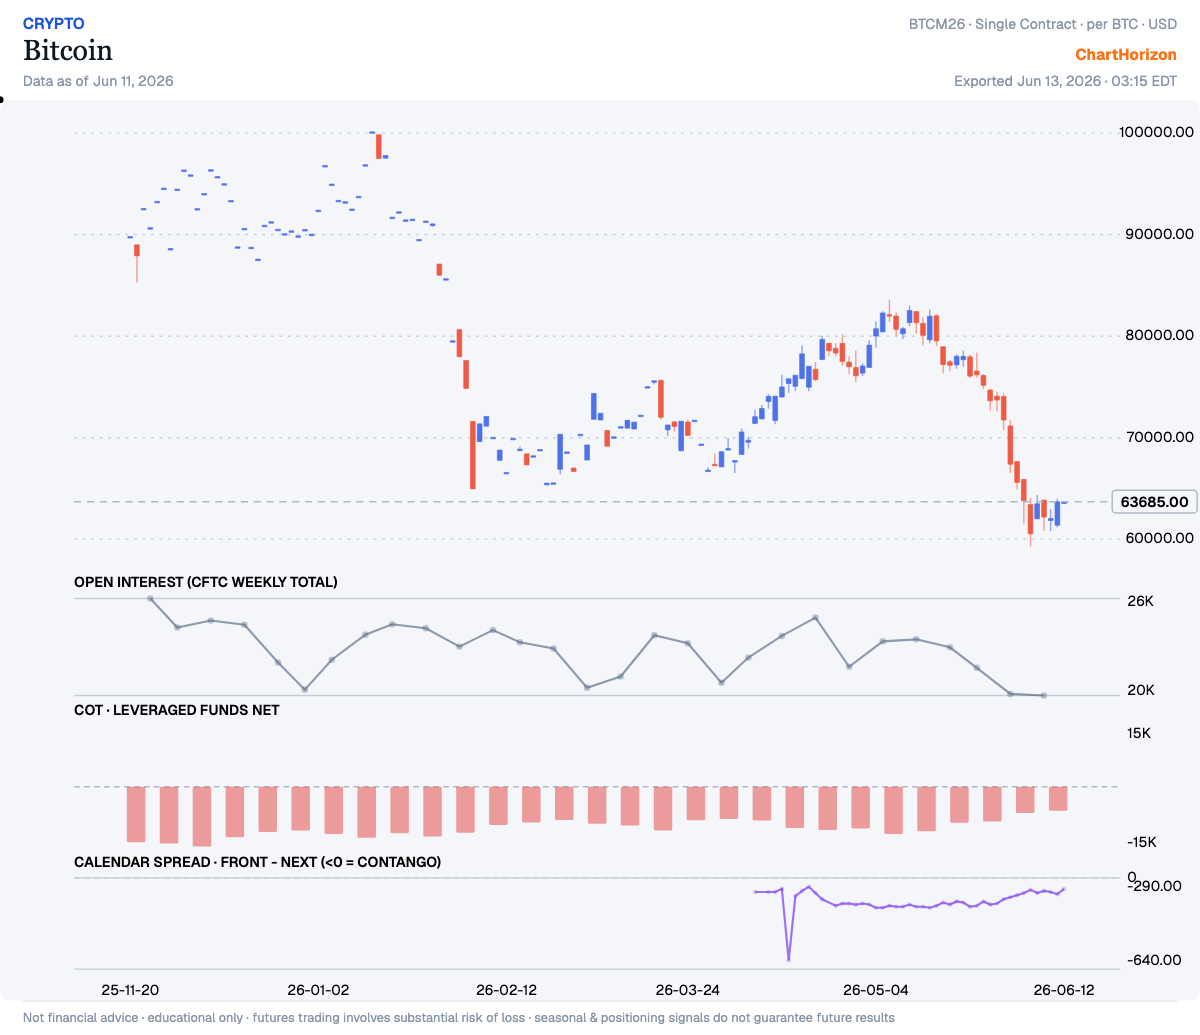
<h2 id="bitcoin--leveraged-funds-at-a-3-year-high">Bitcoin — leveraged funds at a 3-year HIGH</h2>

<p><img src="/assets/posts/2026-06-13-hedgers-ledger/cards/bitcoin.png" alt="Bitcoin — leveraged funds net positioning" width="1200" height="1035" loading="lazy" /></p>

<p>Leveraged Funds Net sits at the 97th percentile of its ~3-year range — the leveraged funds (the fast, speculative money) have been heavy net buyers. Net: -5,995 contracts (as of 2026-06-09). New this week.</p>

<hr />

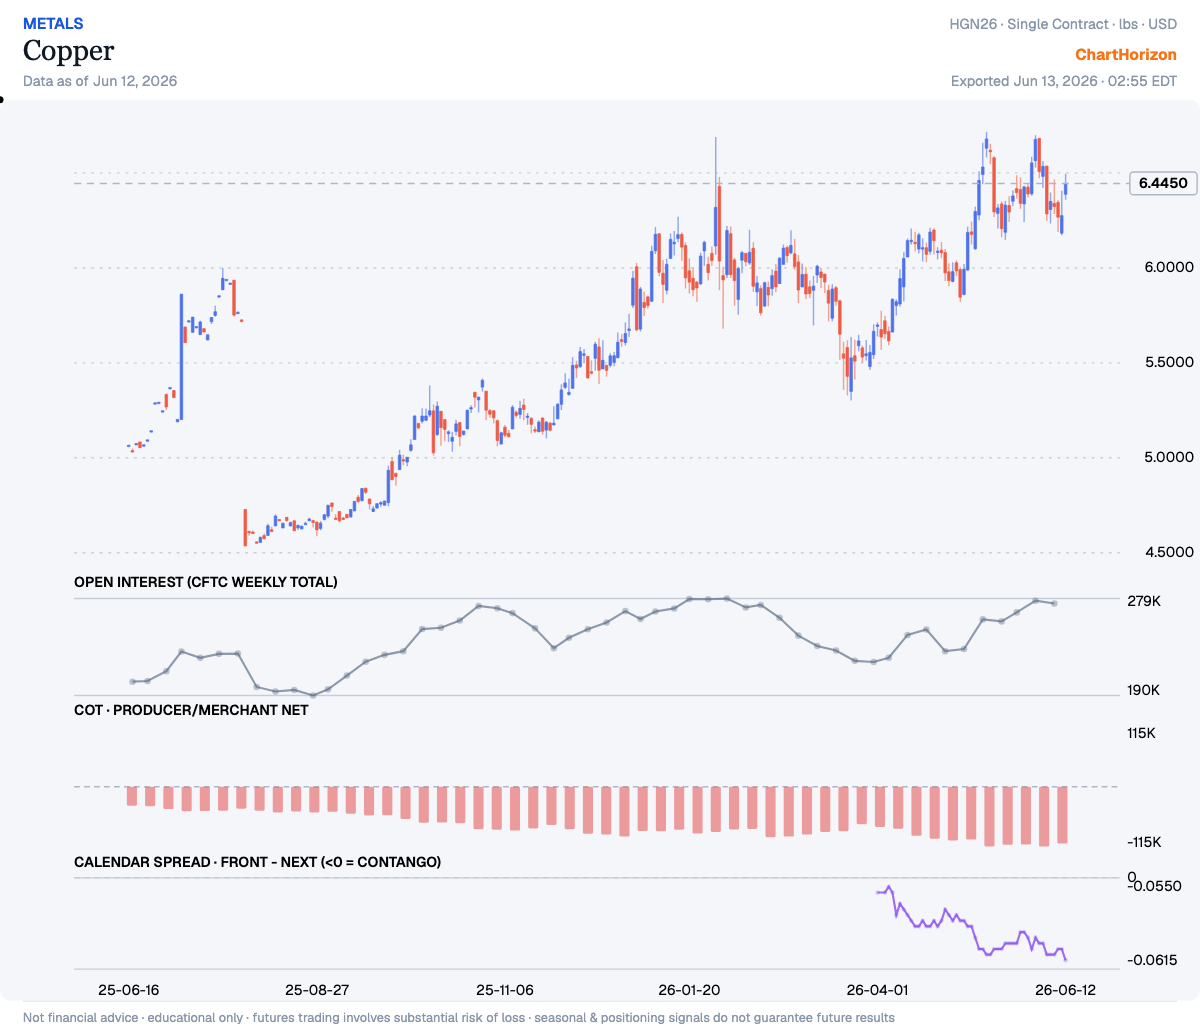
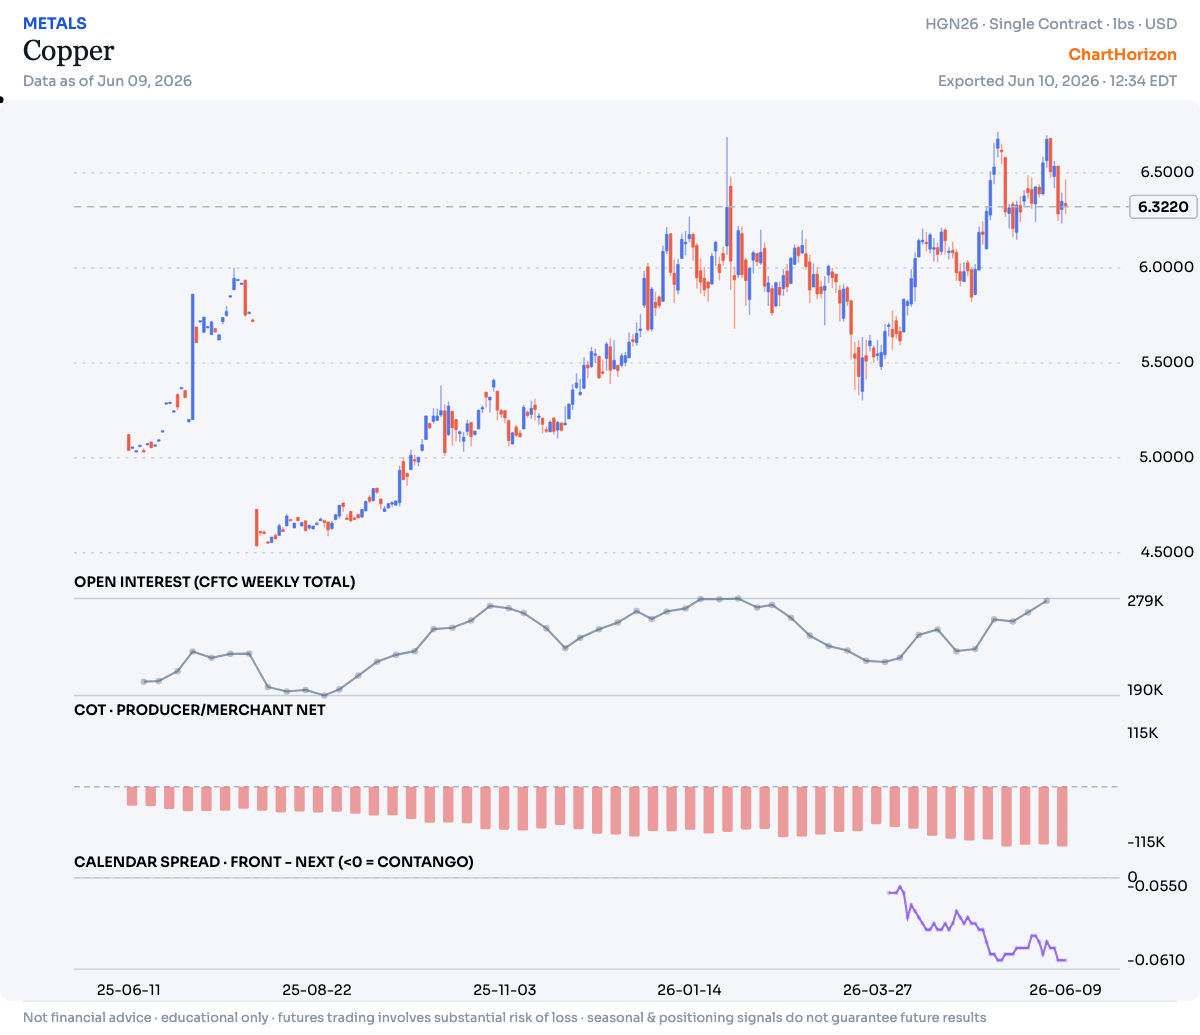
<h2 id="copper--commercials-at-a-3-year-low">Copper — commercials at a 3-year LOW</h2>

<p><img src="/assets/posts/2026-06-13-hedgers-ledger/cards/copper.png" alt="Copper — commercials net positioning" width="1200" height="1035" loading="lazy" /></p>

<p>Producer/Merchant Net sits at the 3rd percentile of its ~3-year range — the commercials (hedgers, the “smart-money” side) have been heavy net sellers. Net: -109,260 contracts (as of 2026-06-09).</p>

<hr />

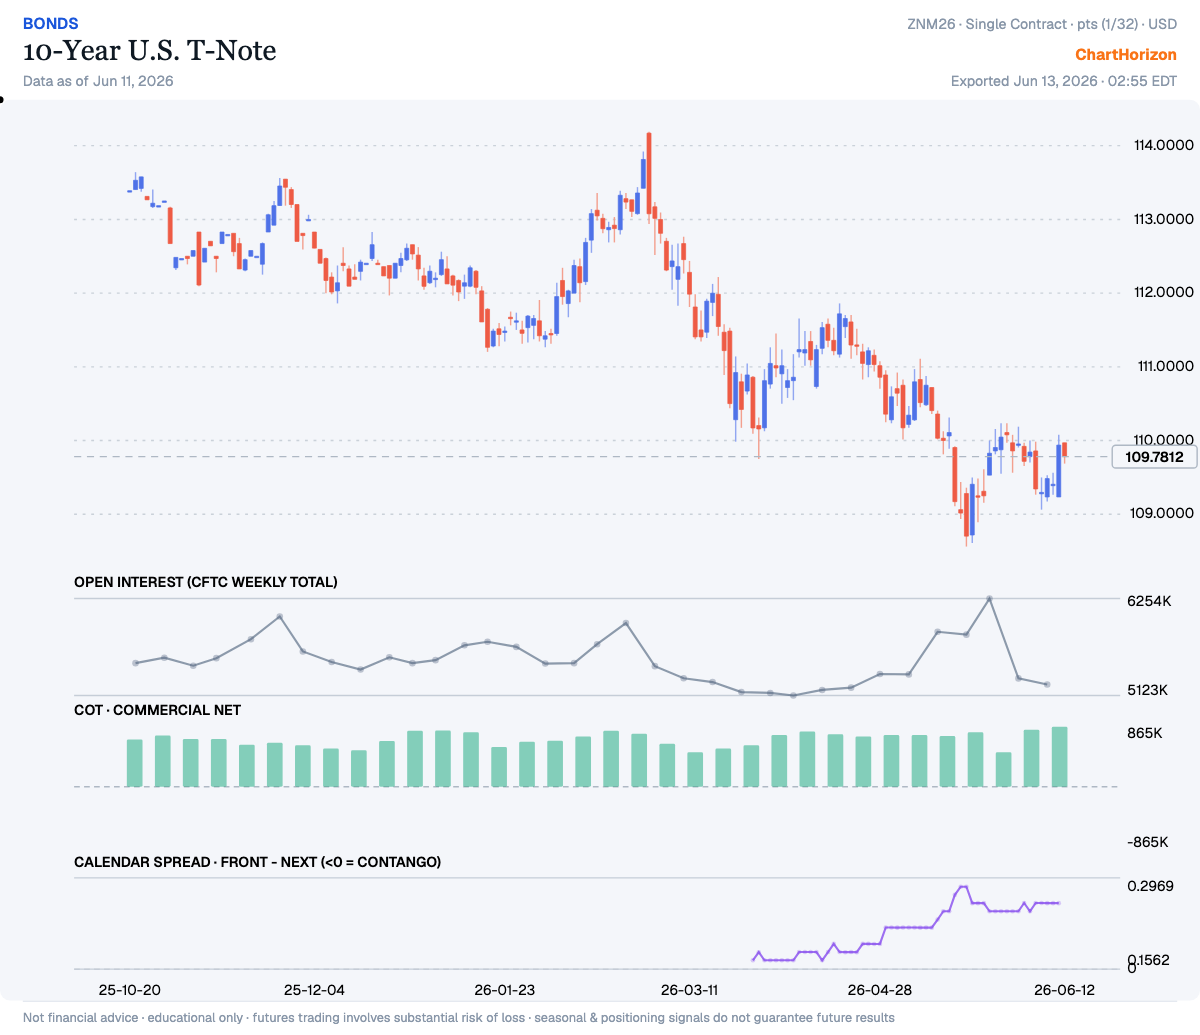
<h2 id="10-year-us-t-note--commercials-at-a-3-year-high">10-Year U.S. T-Note — commercials at a 3-year HIGH</h2>

<p><img src="/assets/posts/2026-06-13-hedgers-ledger/cards/zn_10y.png" alt="10-Year U.S. T-Note — commercials net positioning" width="1200" height="1035" loading="lazy" /></p>

<p>Commercial Net sits at the 96th percentile of its ~3-year range — the commercials (hedgers, the “smart-money” side) have been heavy net buyers. Net: +864,695 contracts (as of 2026-06-09).</p>

<hr />

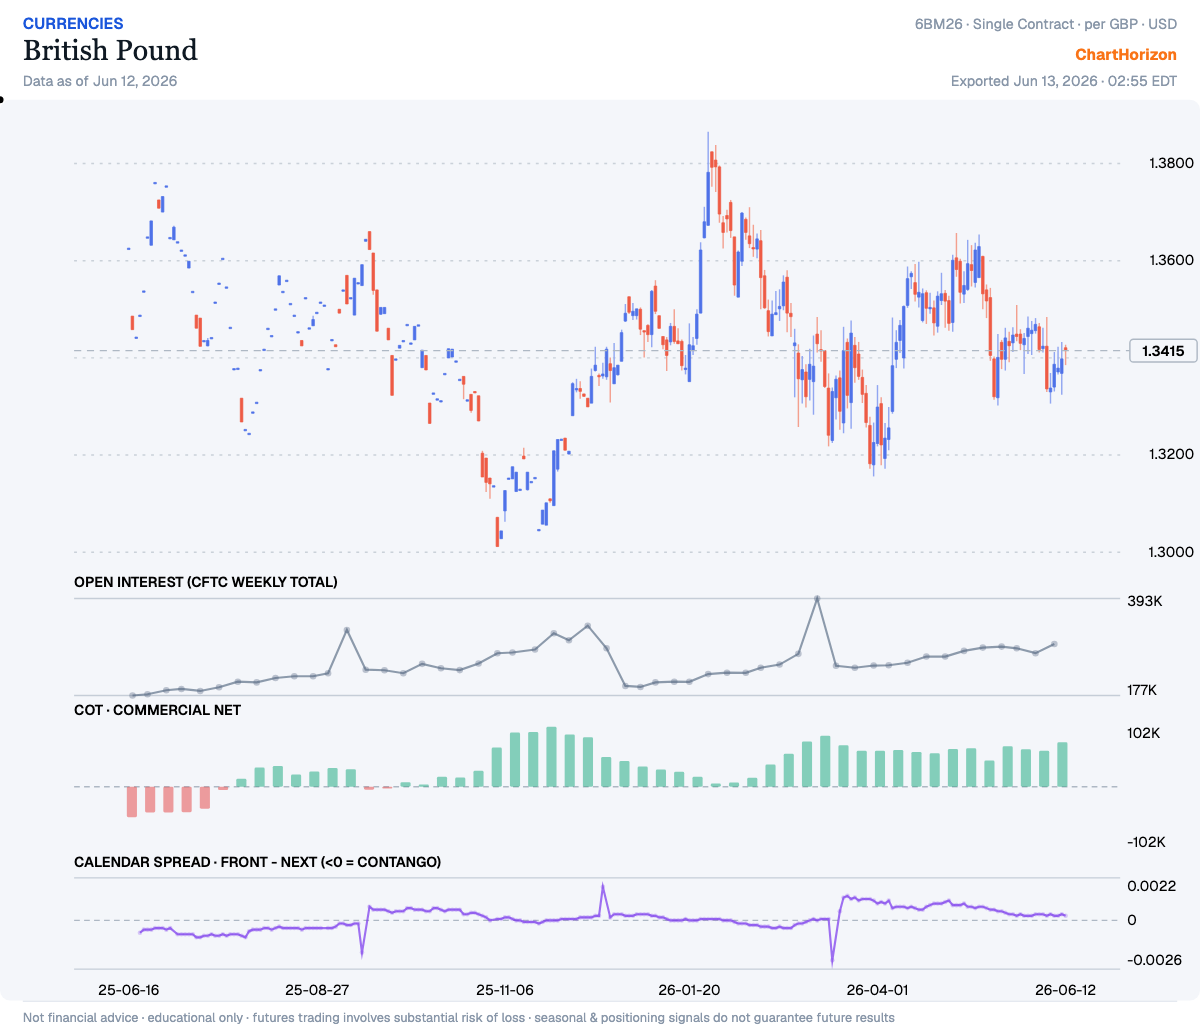
<h2 id="british-pound--commercials-at-a-3-year-high">British Pound — commercials at a 3-year HIGH</h2>

<p><img src="/assets/posts/2026-06-13-hedgers-ledger/cards/gbp_fx.png" alt="British Pound — commercials net positioning" width="1200" height="1035" loading="lazy" /></p>

<p>Commercial Net sits at the 96th percentile of its ~3-year range — the commercials (hedgers, the “smart-money” side) have been heavy net buyers. Net: +75,870 contracts (as of 2026-06-09).</p>]]></content><author><name>ChartHorizon</name></author><summary type="html"><![CDATA[Weekly COT extremes — where the commercial hedgers sit at the edge of their multi-year positioning range. Data: CFTC via ChartHorizon.]]></summary><media:thumbnail xmlns:media="http://search.yahoo.com/mrss/" url="https://chart-horizon.com/assets/posts/2026-06-13-hedgers-ledger/cards/platinum.png" /><media:content medium="image" url="https://chart-horizon.com/assets/posts/2026-06-13-hedgers-ledger/cards/platinum.png" xmlns:media="http://search.yahoo.com/mrss/" /></entry><entry><title type="html">No Tape to Read: A Note on the SpaceX Listing</title><link href="https://chart-horizon.com/2026/06/11/spacex-ipo/" rel="alternate" type="text/html" title="No Tape to Read: A Note on the SpaceX Listing" /><published>2026-06-11T00:00:00+00:00</published><updated>2026-06-11T00:00:00+00:00</updated><id>https://chart-horizon.com/2026/06/11/spacex-ipo</id><content type="html" xml:base="https://chart-horizon.com/2026/06/11/spacex-ipo/"><![CDATA[<p>Tonight, after the bell, the bankers will hand the market a number. One hundred and
thirty-five dollars a share, and a company priced at one and three-quarter trillion —
the seventh-largest concern in the country, ahead of Tesla itself, before a single
share has changed hands in public. Some five hundred and fifty-six million shares,
better than seventy-five billion dollars raised in a night. Tomorrow the rocket-maker
opens on the Nasdaq under the letters SPCX, and the whole crowd will lean toward it at
once. I have seen this leaning before. It is the oldest sound on the Street, and it has
never once changed its tune.</p>

<hr />

<h2 id="a-price-handed-down-not-discovered">A price handed down, not discovered</h2>

<p>A speculator’s first question is never <em>what is it worth?</em> It is <em>what is the tape
telling me?</em> — and here there is no tape. A stock that has never traded has no history,
no record of accumulation or distribution, no proven trend. There is no pivotal point
to wait for, because the market has not yet drawn one. The figure quoted tonight is not
a price the market discovered through the honest argument of buyers and sellers; it is a
price the underwriters fixed and carried on the road, a number handed down rather than
tested. I made my money standing aside until the market itself signaled the line of
least resistance, then sitting once it had. A first-day issue offers me nothing to stand
on and nothing to sit on. It is all hope — and hope is one of the four standing enemies
of every man who speculates: greed, fear, hope, and ignorance. They empty more accounts
between them than any panic ever did.</p>

<hr />

<h2 id="you-may-own-the-shares-you-will-not-steer-the-ship">You may own the shares; you will not steer the ship</h2>

<p>Read the filing past the headline and you find the thing that should matter most to a
man parting with his capital. After the offering, the founder keeps better than
eighty-two percent of the voting control. You may buy the shares. You will not steer the
ship, nor check the man at the wheel, nor be consulted when he changes course — and this
is a man who changes course. Daniel Drew taught Vanderbilt that lesson in the Erie war:
he printed fresh stock faster than the Commodore could buy it, and Vanderbilt went on
paying good money for paper that was being watered under his feet. The mechanics are
cleaner now and the lawyers more careful, but a share that carries the full price of
ownership and almost none of its say is not the bargain the prospectus makes it sound.
The control stays exactly where it has always been.</p>

<hr />

<h2 id="ask-who-is-selling-and-why-now">Ask who is selling, and why now</h2>

<p>There is a question the crowd never asks in its enthusiasm: who is on the other side of
this trade? Somebody is selling me these shares, and it is worth knowing who, and why,
and what they understand about the price that I do not. They are selling because the
demand is loud, the figure is rich, and the moment is theirs to choose. This is not new.
When Morgan’s syndicate needed to place three-quarters of a million shares of U.S. Steel
in 1901, they did not ring a bell and announce it to the public. They engaged James
Keene to feed that block into an eager market quietly, routed through a broker’s name
that hid the Morgan hand — distributing at the top while the public believed it was
buying into strength. The clothes are better cut today and the thing is called a
roadshow, but the direction of the paper has not reversed in a century and a quarter: it
moves from the people who hold it to the people who want it, at the hour that suits the
holder.</p>

<hr />

<h2 id="what-the-patient-money-does">What the patient money does</h2>

<p>Set all this against the men and women who <em>kept</em> their fortunes rather than merely made
them, for keeping is the harder trick by far. Bernard Baruch, the Lone Wolf, moved out
of stocks into bonds and cash and gold years before the 1929 top, and when a pool came
to him asking that he help prop the market up, he declined — and he kept what he had.
Hetty Green, whom a jealous Street called a witch for the sin of prudence, put it
plainest: she bought when things were low and nobody wanted them, she held until they
rose, and she never once bought on margin in her life. Neither of them ever chased the
loudest issue on the board on its opening morning. They understood what the impatient
never learn — that cash is itself a position, and frequently the strongest one on the
table; that the operator who must always be holding <em>something</em> is the operator who is
always wrong <em>somewhere</em>. It was never the buying or the selling that made the big
money. It was the sitting. And a man cannot sit on a stock that has no seat yet to take.</p>

<hr />

<h2 id="the-verdict">The verdict</h2>

<p>Understand me plainly: this is no call to sell the rocket short. I do not short a thing
merely because the crowd has fallen in love with it — that is the very same blunder as
buying it, worn inside out. The market is never wrong, and in its own time SPCX will
tell its story on the tape. It will trade in earnest, find real buyers and real sellers,
carve out a range, and one day declare a line of least resistance clearly enough that a
patient man may act on it and sit. That day is not tomorrow. Tomorrow is the spectacle,
and the spectacle is staged for the crowd, not for the speculator. So let the issue
trade. Let it find its level without your money riding inside it. Let the first sellers
sell to the first dreamers, and let the price prove something on its own account before
you ask it to prove something for yours. The hottest issue on the board is always the
one with the shortest history behind it, and a speculator trades the history, not the
heat. Keep your capital in your pocket and your eye on the tape. The rocket will still be
there the day it finally hands you a reason.</p>]]></content><author><name>ChartHorizon</name></author><summary type="html"><![CDATA[SpaceX (SPCX) prices its IPO at $135 for a $1.77 trillion Nasdaq debut. A Livermore-voice case for why a speculator waits for a tape before chasing the hottest new issue.]]></summary><media:thumbnail xmlns:media="http://search.yahoo.com/mrss/" url="https://chart-horizon.com/assets/og-default.png" /><media:content medium="image" url="https://chart-horizon.com/assets/og-default.png" xmlns:media="http://search.yahoo.com/mrss/" /></entry><entry><title type="html">The Hedgers’ Ledger — 2026-06-10</title><link href="https://chart-horizon.com/2026/06/10/hedgers-ledger/" rel="alternate" type="text/html" title="The Hedgers’ Ledger — 2026-06-10" /><published>2026-06-10T00:00:00+00:00</published><updated>2026-06-10T00:00:00+00:00</updated><id>https://chart-horizon.com/2026/06/10/hedgers-ledger</id><content type="html" xml:base="https://chart-horizon.com/2026/06/10/hedgers-ledger/"><![CDATA[<p>The report dated June 2, 2026 shows four markets registering fresh positioning extremes against the three-year window, with the board splitting cleanly down the middle — two highs, two lows, and no ambiguity about which side owns the record territory: both fresh window records fall on opposite ends, the E-mini Nasdaq 100 pressing a commercial positioning high and Copper pressing a low. That the records land on contrary sides of the ledger in the same week, and that all four entries are new to this report, gives the board a hard, stretched quality — commercials leaning away from equities and crude on one rail while pulling back sharply from copper and soybean oil on the other. When the tape sets records simultaneously at both extremes, the prudent reader notes the tension and waits; the resolution, when it comes, will announce itself plainly.</p>

<table>
  <thead>
    <tr>
      <th>Market</th>
      <th>Side</th>
      <th>Percentile</th>
      <th>New</th>
    </tr>
  </thead>
  <tbody>
    <tr>
      <td>E-mini Nasdaq 100</td>
      <td><span class="mark-bull">▲ HIGH</span></td>
      <td>100th</td>
      <td>New</td>
    </tr>
    <tr>
      <td>Copper</td>
      <td><span class="mark-bear">▼ LOW</span></td>
      <td>1st</td>
      <td>New</td>
    </tr>
    <tr>
      <td>WTI Crude Oil</td>
      <td><span class="mark-bull">▲ HIGH</span></td>
      <td>99th</td>
      <td>New</td>
    </tr>
    <tr>
      <td>Soybean Oil</td>
      <td><span class="mark-bear">▼ LOW</span></td>
      <td>4th</td>
      <td>New</td>
    </tr>
  </tbody>
</table>

<hr />

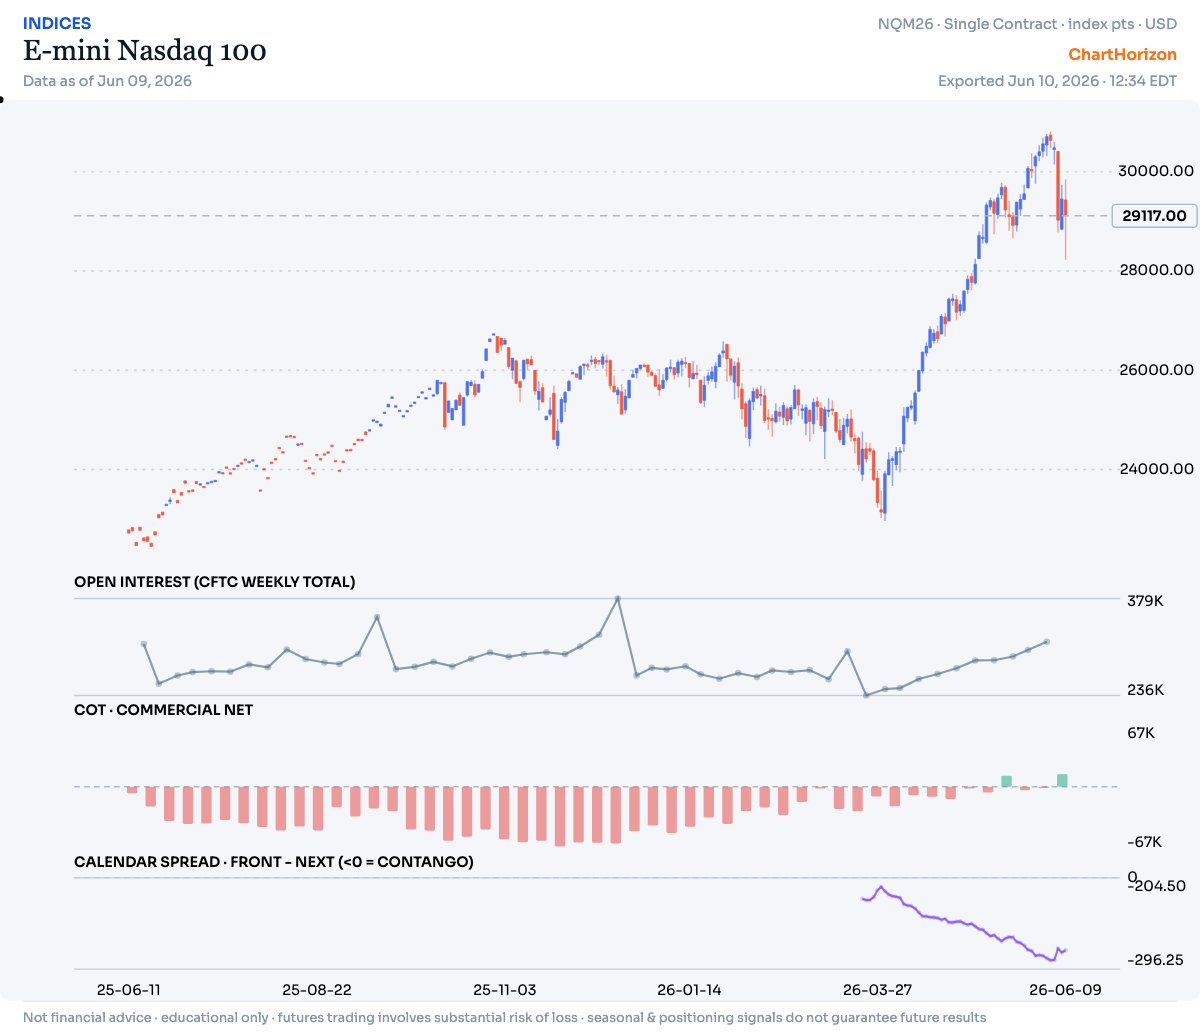
<h2 id="e-mini-nasdaq-100--commercials-at-a-3-year-high-fresh-record">E-mini Nasdaq 100 — commercials at a 3-year HIGH (fresh record)</h2>

<p><img src="/assets/posts/2026-06-10-hedgers-ledger/cards/nq_nasdaq.png" alt="E-mini Nasdaq 100 — commercial net positioning" width="1200" height="1035" loading="lazy" /></p>

<p>Commercial Net sits at the 100th percentile of its ~3-year range — the commercials (hedgers, the “smart-money” side) have been heavy net buyers. That is a fresh record for the window. Net: +13,812 contracts (as of 2026-06-02). New this week.</p>

<p>One caveat worth flagging: the positioning here reads bullish, but the spread indicator is pointing firmly the other way — the term structure is rolling over to the downside even as the commercials sit at a record long. When the hedgers say one thing and the structure says another, the disagreement is itself the signal: it hints that the advance may be hollow, that the up-move is being held up by something other than genuine demand for forward supply. A record-long commercial book on its own looks like conviction; set against a structure that is sliding, it looks more like a move that has not yet proven it is real.</p>

<hr />

<h2 id="copper--commercials-at-a-3-year-low-fresh-record">Copper — commercials at a 3-year LOW (fresh record)</h2>

<p><img src="/assets/posts/2026-06-10-hedgers-ledger/cards/copper.png" alt="Copper — commercial net positioning" width="1200" height="1035" loading="lazy" /></p>

<p>Producer/Merchant Net sits at the 1st percentile of its ~3-year range — the commercials (hedgers, the “smart-money” side) have been heavy net sellers. That is a fresh record for the window. Net: -114,904 contracts (as of 2026-06-02). New this week.</p>

<hr />

<h2 id="wti-crude-oil--commercials-at-a-3-year-high">WTI Crude Oil — commercials at a 3-year HIGH</h2>

<p><img src="/assets/posts/2026-06-10-hedgers-ledger/cards/wti_crude.png" alt="WTI Crude Oil — commercial net positioning" width="1200" height="1035" loading="lazy" /></p>

<p>Producer/Merchant Net sits at the 99th percentile of its ~3-year range — the commercials (hedgers, the “smart-money” side) have been heavy net buyers. Net: +358,016 contracts (as of 2026-06-02). New this week.</p>

<hr />

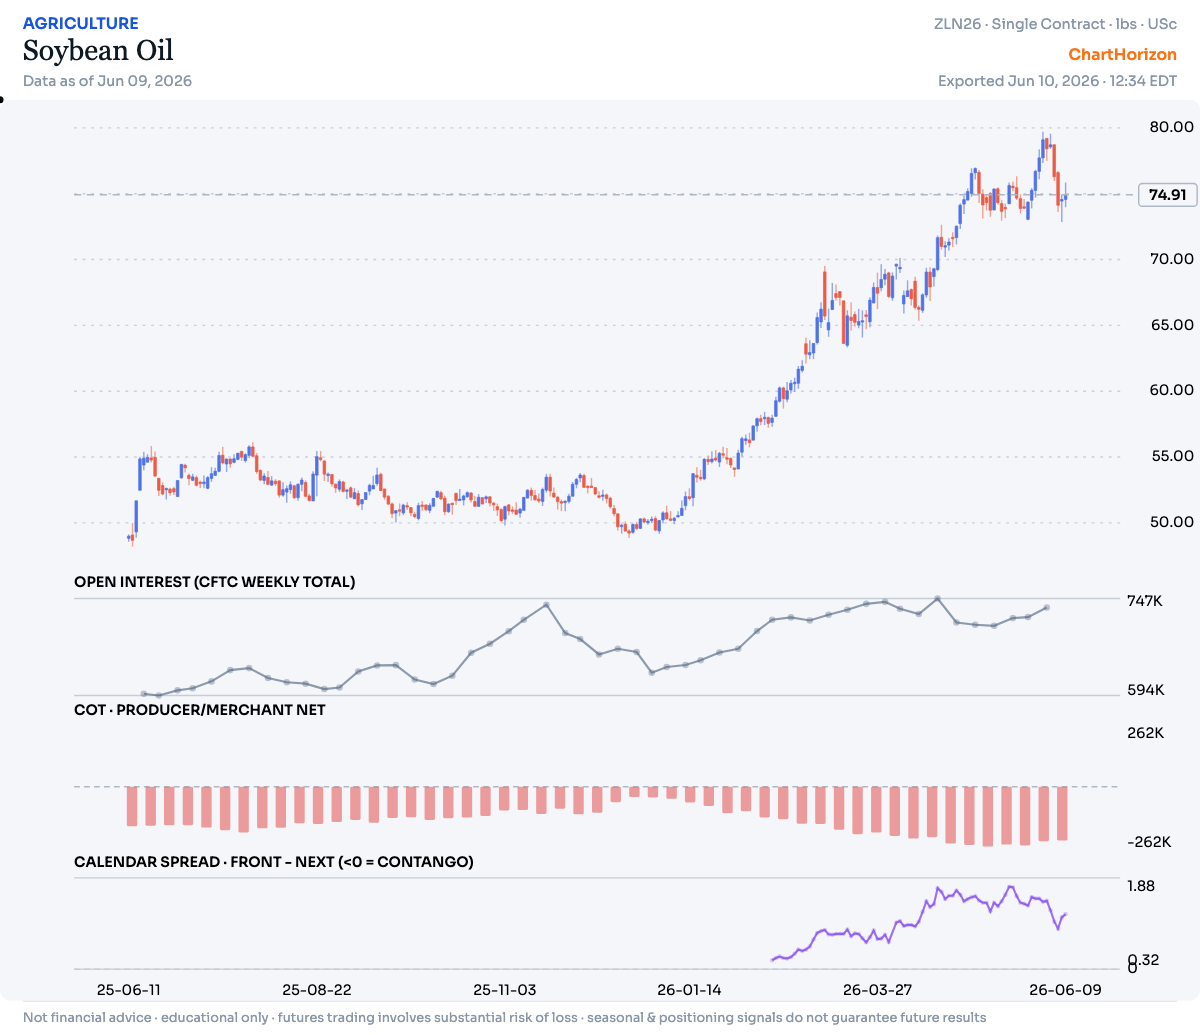
<h2 id="soybean-oil--commercials-at-a-3-year-low">Soybean Oil — commercials at a 3-year LOW</h2>

<p><img src="/assets/posts/2026-06-10-hedgers-ledger/cards/soybean_oil.png" alt="Soybean Oil — commercial net positioning" width="1200" height="1035" loading="lazy" /></p>

<p>Producer/Merchant Net sits at the 4th percentile of its ~3-year range — the commercials (hedgers, the “smart-money” side) have been heavy net sellers. Net: -235,283 contracts (as of 2026-06-02). New this week.</p>]]></content><author><name>ChartHorizon</name></author><summary type="html"><![CDATA[Weekly COT extremes — where the commercial hedgers sit at the edge of their multi-year positioning range. Data: CFTC via ChartHorizon.]]></summary><media:thumbnail xmlns:media="http://search.yahoo.com/mrss/" url="https://chart-horizon.com/assets/posts/2026-06-10-hedgers-ledger/cards/nq_nasdaq.png" /><media:content medium="image" url="https://chart-horizon.com/assets/posts/2026-06-10-hedgers-ledger/cards/nq_nasdaq.png" xmlns:media="http://search.yahoo.com/mrss/" /></entry></feed>