The Weekly Tape — Three Rallies, One Seller
Prices through July 17 · Positioning through the July 14 COT · An intermarket note · Data: ChartHorizon
A rally is a claim, and a claim needs signatures. When the public buys a move, I want to know who is on the other side of the slip — because if the seller is the man who owns the goods, the man whose business it is to know what the goods are worth, then the advance is not a verdict; it is a transaction. This week the board hands me three advances to read, in three different corners of the market, and when I turn each one over I find the same name signing the sell side every time. The grain producers are selling the pop in corn and wheat. The sugar and cotton trade is selling every bounce, over some of the deepest commercial short books on the board. And in the stock indices, the commercial book that was long in early June has walked clear across the ledger and come out short — while the averages take turns failing at the highs. Three rallies, one seller. That is the week.
The grains — a rally the producers are selling
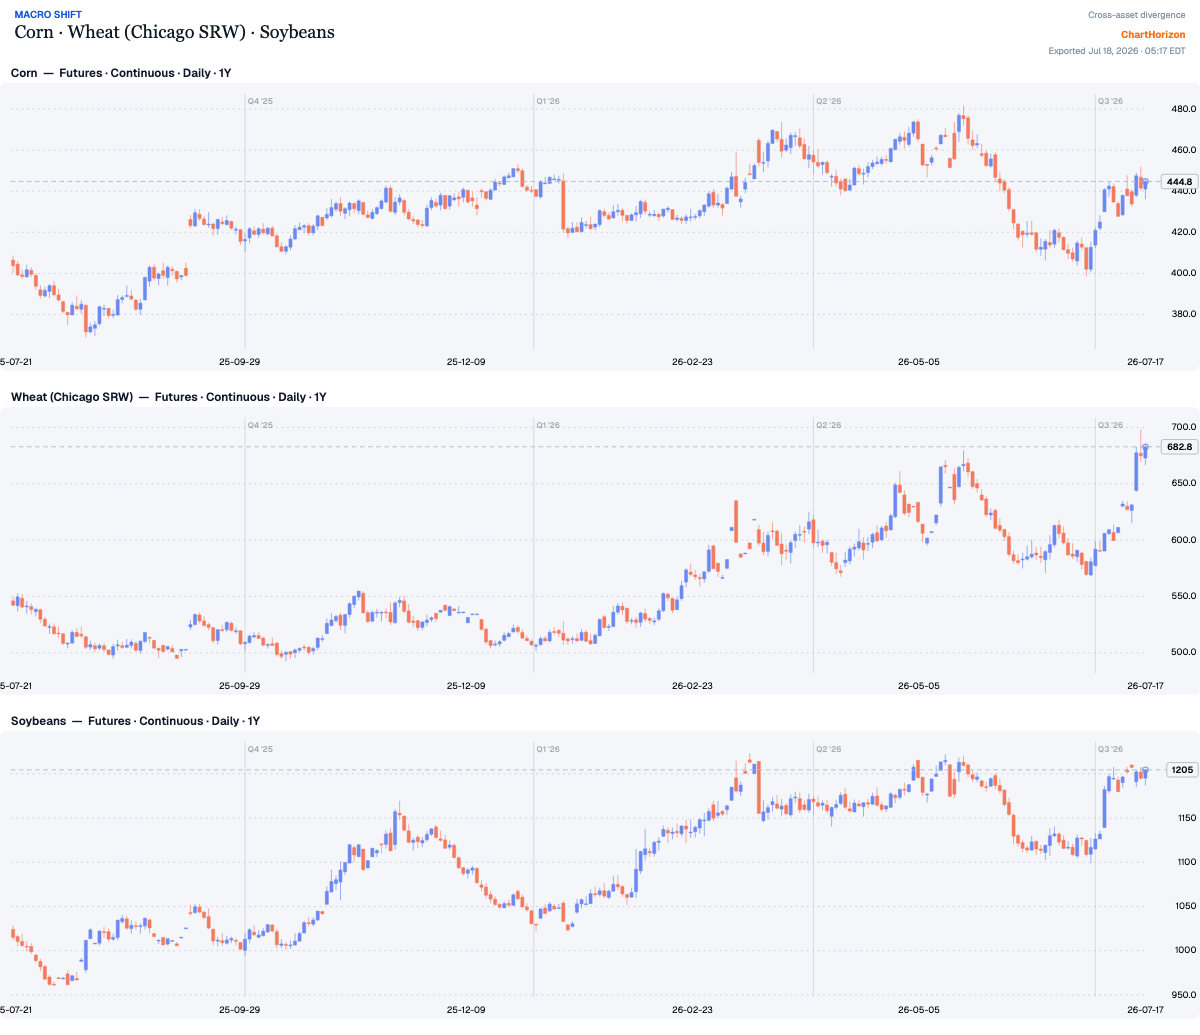
On its face the grain board had a fine week. Wheat ran eight percent in five sessions and closed Friday at 682¾, the highest weekly close in a year, pressing at the 700 line. Corn is up better than ten percent from its late-June washout at 402, back to 444¾. The crowd reads that tape and sees a bull market starting. I read the slips underneath it, and I find three reasons to withhold my signature.
First, the seller. In the July 14 Commitments report — taken while wheat was running — the wheat producers and merchants more than tripled their net short, from 12,800 contracts to 45,600 in a single reporting week, pushing the book below their own twelve-month hedging program. The men who grow the stuff, store the stuff, and ship the stuff met this rally with both hands. Corn tells it the same way: the producer book has deepened from 353,000 net short at the end of June to 417,100 now — they sold better than 60,000 contracts into the bounce. When the price of a thing goes up and the people closest to the thing sell it harder, the advance is being supplied, not chased.
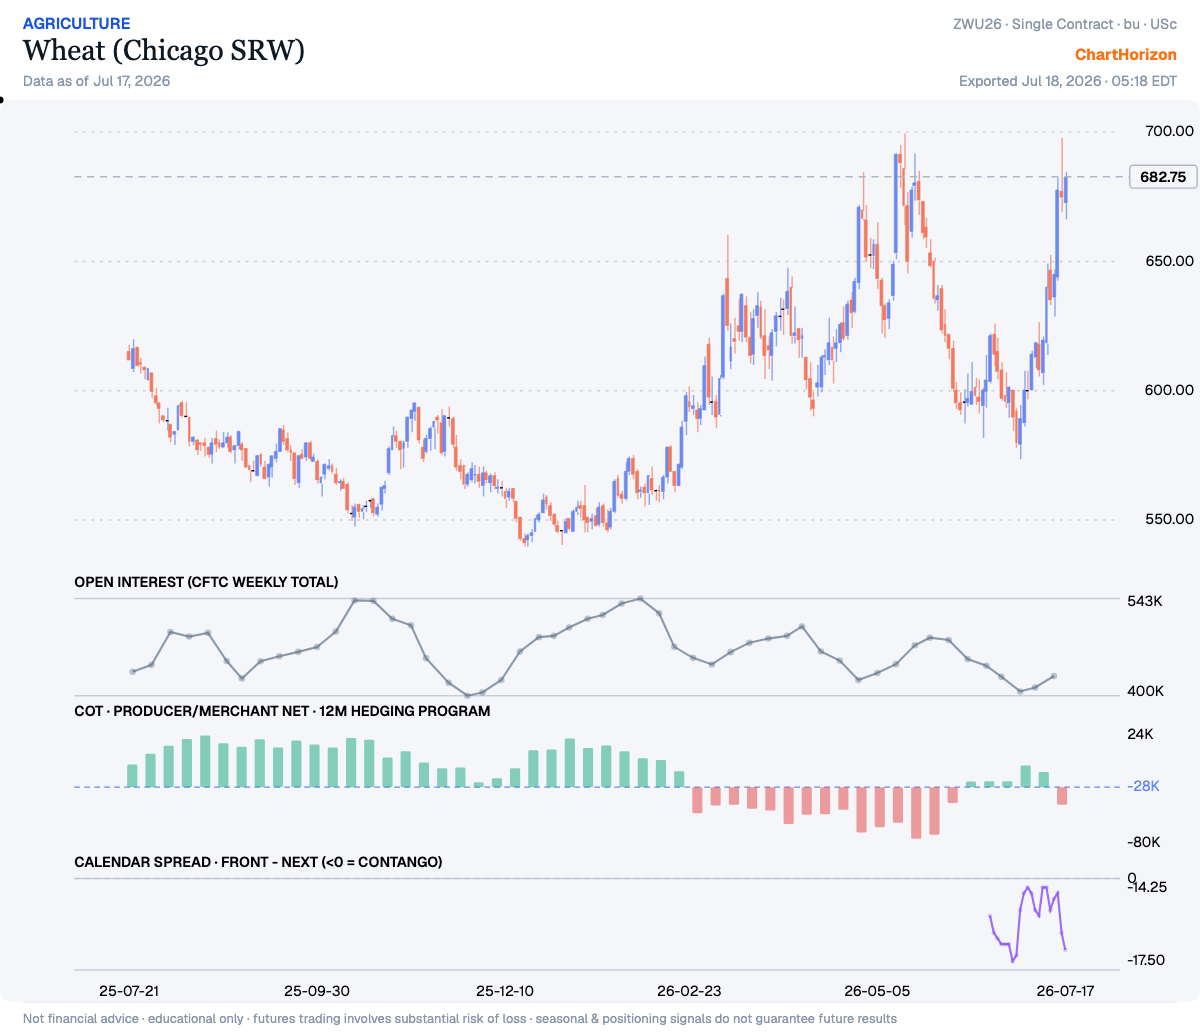
Second, the carry. A market that is genuinely short of grain pays up for the nearby delivery; the front month goes to a premium because somebody needs the goods now. Neither grain does anything of the kind. September wheat closed 17 cents under December; September corn sits 22¾ cents under December, and that discount widened while the price rallied. The cash market, in other words, declined to co-sign the futures move. A rally in the deferred hope while the nearby delivery goes begging is the shape a short-covering scramble leaves on the tape — not the shape of scarcity.
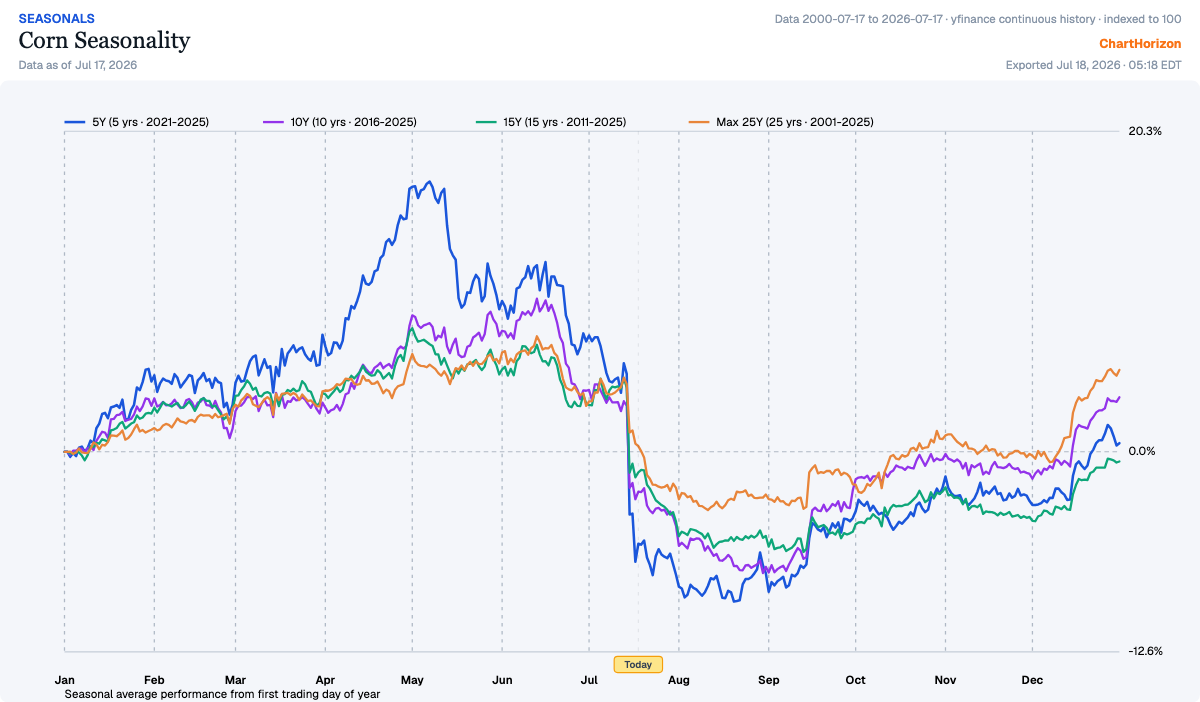
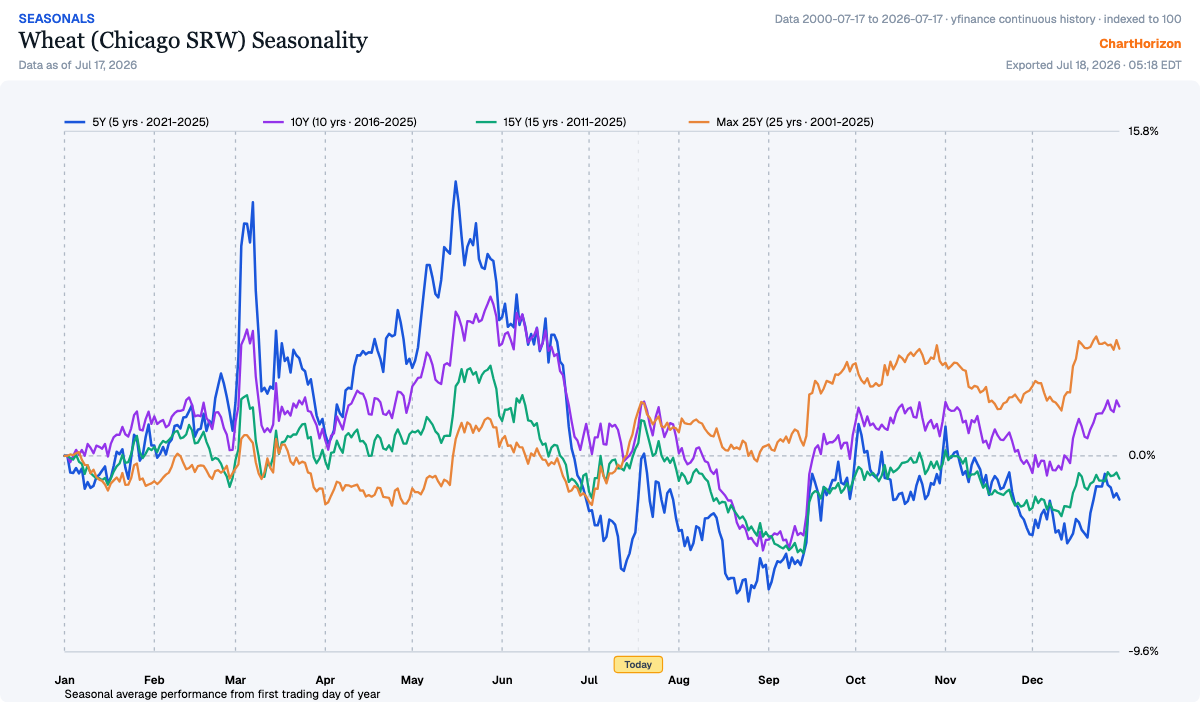
Third, the calendar. Look where “Today” stands on corn’s seasonal chart: at the lip of the steepest downhill stretch of its whole year. Every curve — five-year, ten, fifteen, twenty-five — rolls off a cliff from mid-July into an August trough, as the market takes the measure of the crop it can finally see. ChartHorizon’s gated seasonal gauge has corn inside a bearish window through August 3. Wheat is a week behind it: the gauge flips bearish on July 26, and the modern curves slide from late July to a harvest-pressure low in early September.
Now the honest ledger. Corn’s board is not unanimous — the hedging-program gauge still reads bullish there, one dissenting light among three bearish, and a dissent is to be respected. And a market that closes the week at a 52-week high, as wheat just did, is never to be shorted on opinion; strength like that can run further than any reasoning about it. I am not calling the top of this move. I am saying the move has not proved itself: the producers are selling it, the cash market will not confirm it, and the season is about to lean on it. A false move is exposed by its failure, not by a man’s suspicion of it. Let wheat print its first failure under 700 — a sharp reversal that holds — and the story writes itself. Until then the burden of proof sits on the rally, and the rally is borrowing, not earning.
The softs — sold at the top of every bounce
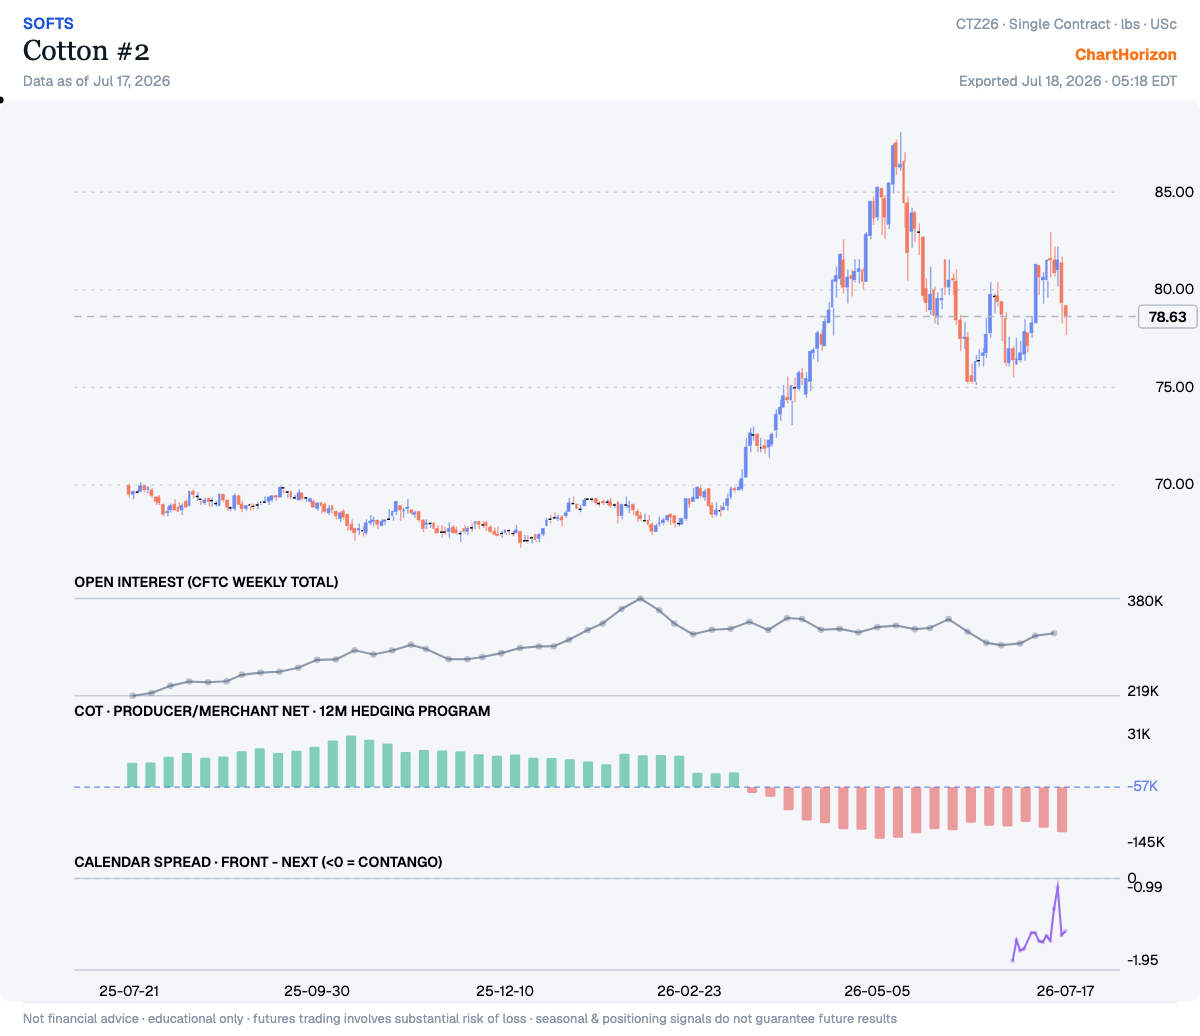
Cotton showed the whole pattern in miniature this week. Midweek it poked above 80½ — its best close in nearly two months — and by Friday it had given the entire pop back and more, down three and a half percent on the week to the 77 line. That is the second time since May the market has run at the low 80s and been thrown back. And underneath it the producer and merchant book has been grinding to its deepest net short in three years — 133,900 contracts — an extreme fresh enough that it walked onto this week’s Hedgers’ Ledger as a new arrival. The pattern of a market that cannot hold a two-day rally over a record commercial short is not the pattern of a bottom. The seasonal chart offers the bull no help either: the gauge is neutral today and turns outright bearish on August 29.
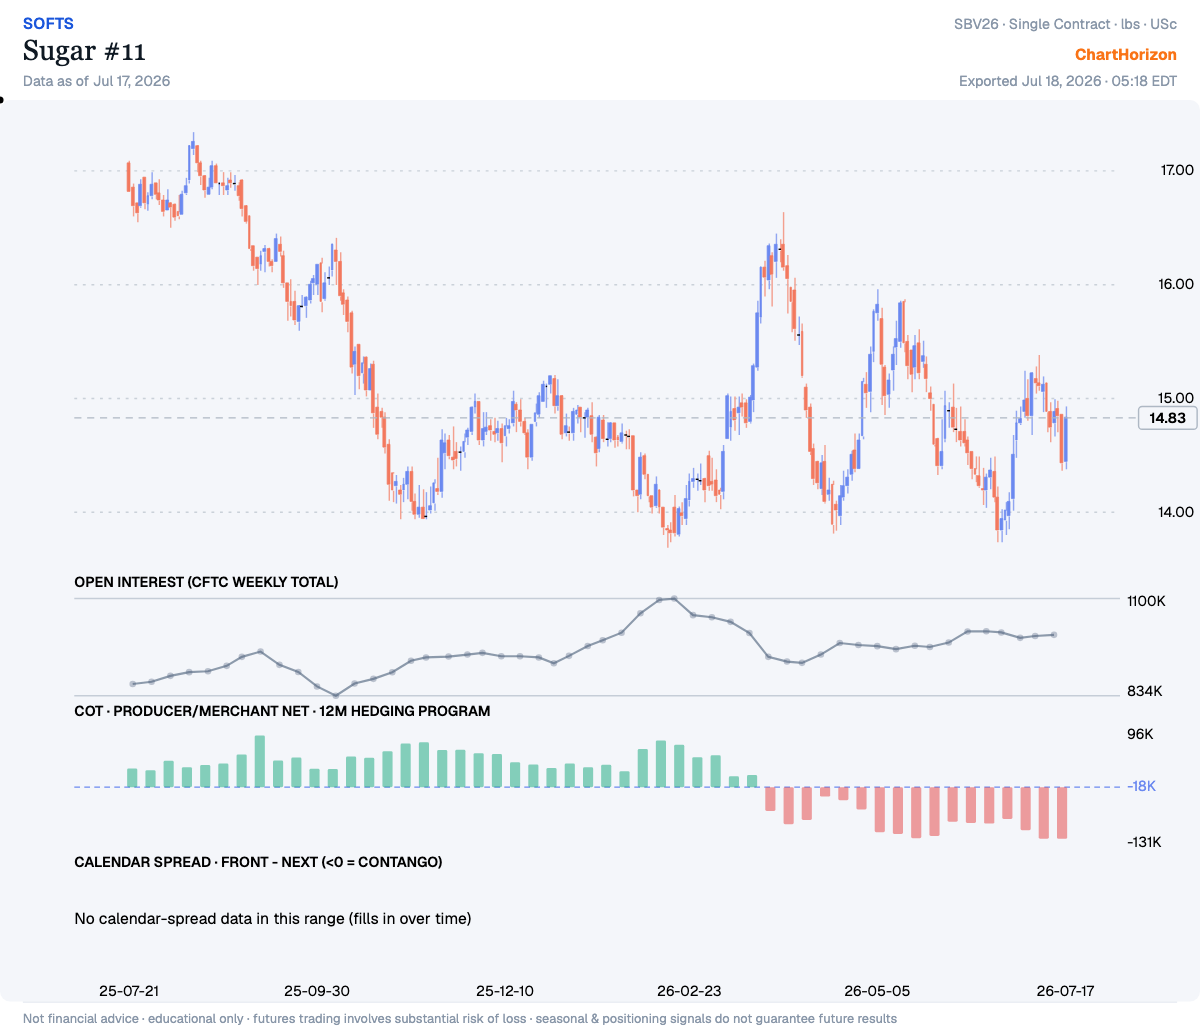
Sugar is the same book with a slower clock. Read the year on the October contract: 16.8 in February, 16 flat in May, 15.2 at the start of July — a staircase of lower highs, each rally sold a little sooner than the last, working down into the 14s. Friday’s bounce to 14.83 does not change the shape of that staircase; it is the same one-day flourish that has appeared at every step of the decline. The producers sit 131,200 contracts net short, having added better than 40,000 in three weeks — the selling into strength here is not an event, it is a policy.
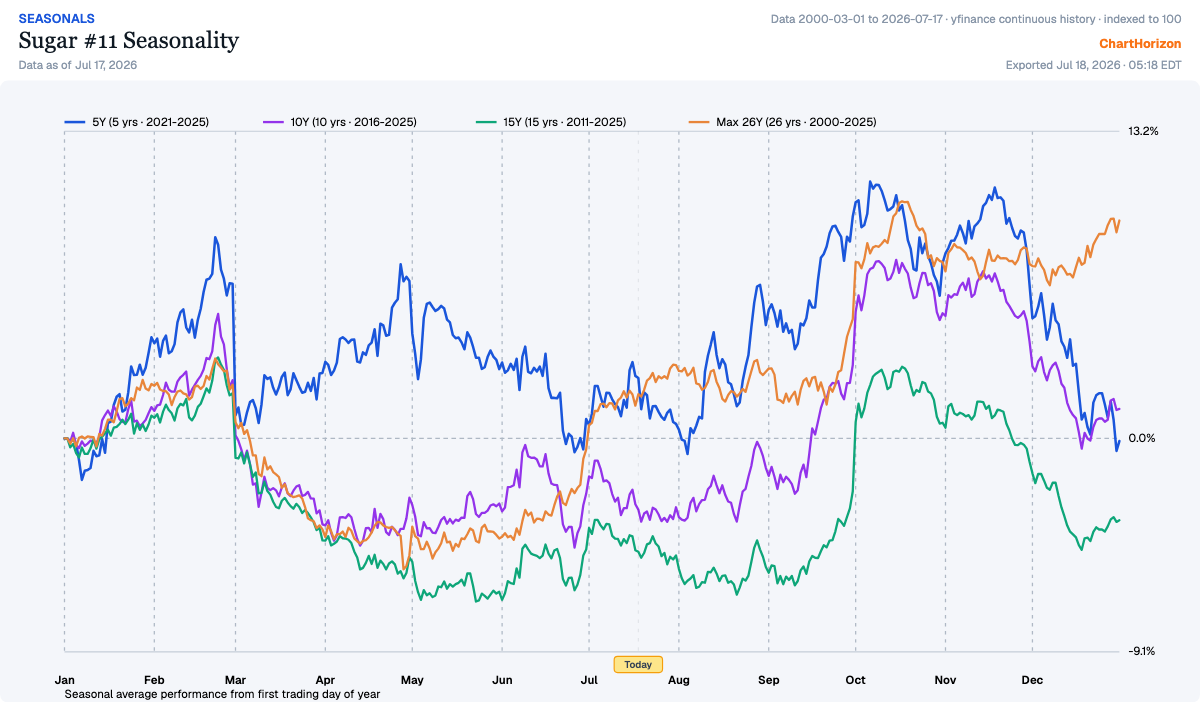
But mark the calendar, because sugar’s bear has a clock on him. The seasonal road is empty through August — and then it is not: every curve on the chart turns up hard into September and October, and the gated gauge flips bullish on September 2. Six weeks of open road, then the wind changes. A short position in sugar is a tenant, not an owner, and his lease is dated. Press the downtrend while the calendar is quiet; be gone before the October ramp arrives to squeeze the late sellers.
The indices — the top with a process to it
A month ago, when the averages first stopped agreeing with each other, I wrote that the advance had gone hollow — and that hollow things often make one more high before the floor goes. The tape has spent the four weeks since obliging that sentence almost to the letter. The S&P ran all the way back to the old top and stopped: 7623¾ on June 2, 7620¼ on July 10 — a double top five weeks apart, three and a half points between the two prints. The Dow, the narrowest and heaviest of the leaders, made its yearly closing high on July 6, alone, exactly the way a distribution likes to send up its last flare. And the Nasdaq — the growth index, the index that led the whole advance — never confirmed either of them. Its recovery in late June fell just short of the June 2 top, and it has fallen away in almost a straight line since: down four percent this week alone, closing Friday within one percent of its June 10 low. The leader of the bull market is the first one back at the floor. That ordering is not an accident; it is the process.
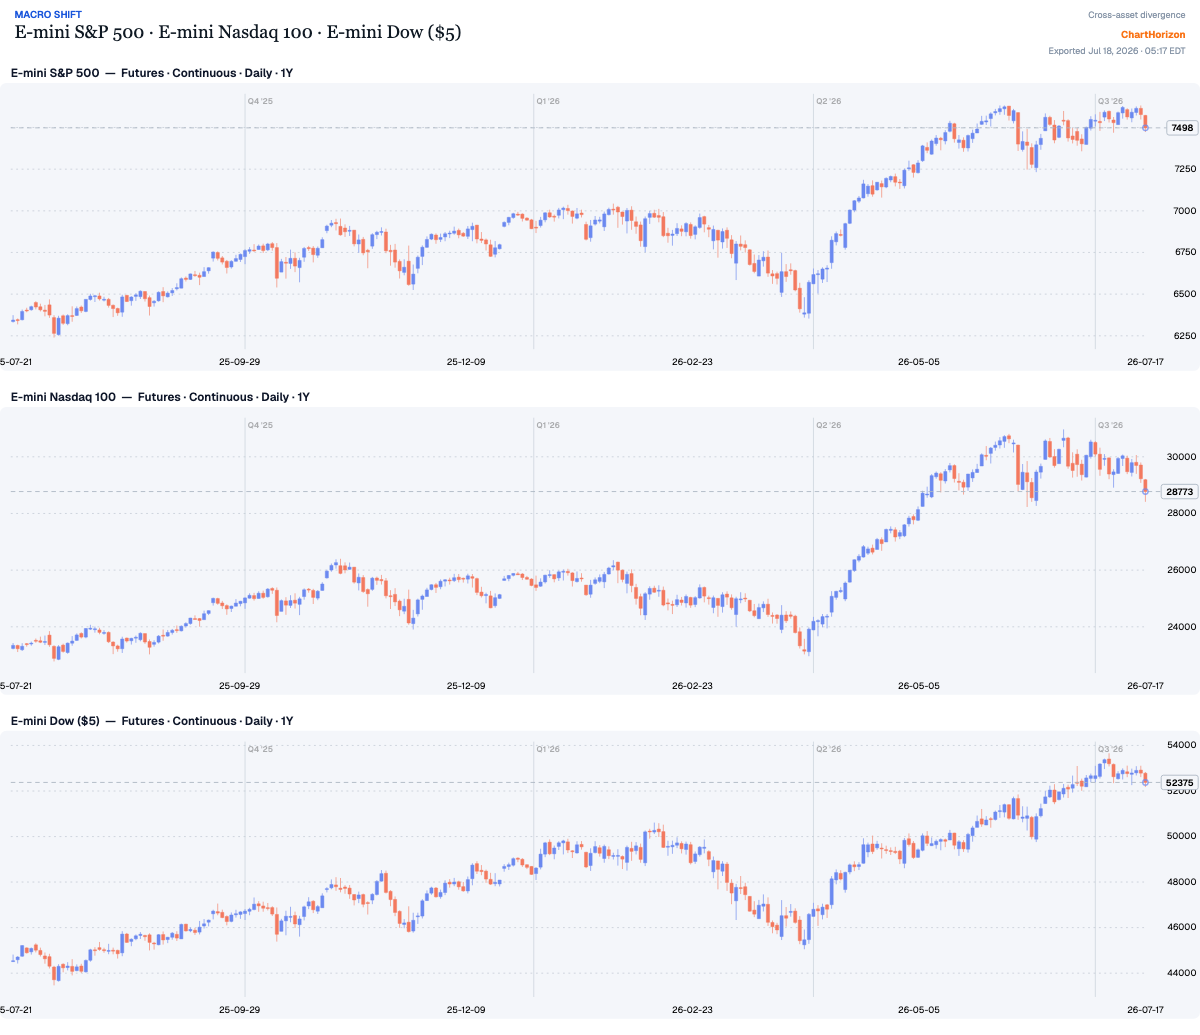
Now set the positioning beside the price. On June 9 the S&P commercial book stood 90,700 contracts net long. Five weeks later it stands 92,500 net short — a swing of more than 180,000 contracts, executed precisely across the weeks the index was pressing at its highs. The Dow commercials have deepened from 2,900 short to 18,700 over the same stretch. I will keep the ledger honest: the Nasdaq commercial book is roughly flat, a few thousand short, arguing nothing — the Nasdaq’s evidence is its price, which is doing the arguing loudly enough. But the S&P’s book is the widest swing on the whole board this month, and it points one way: the interests that were financing the advance in June are financing the other side of it in July.
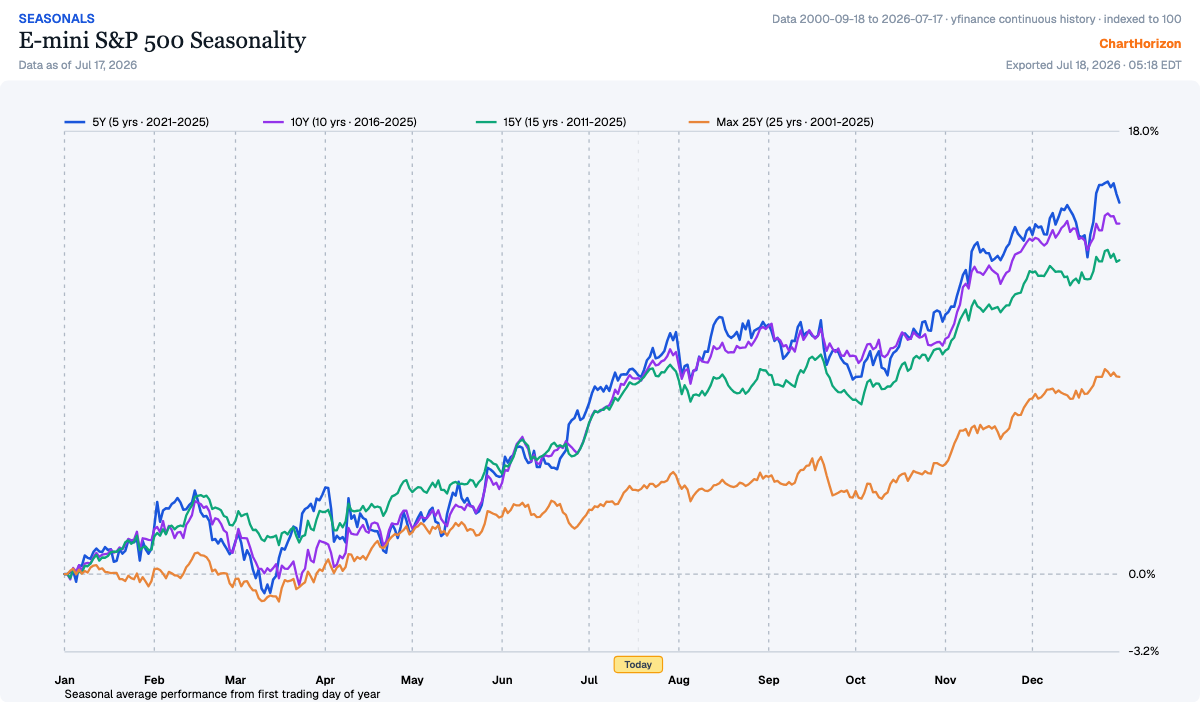
The seasonal chart I will read to you straight, because it is not a bear’s chart. The S&P’s curves climb nearly all year; what they show from late July into October is not a cliff but a shelf — the one flat, choppy stretch in the whole profile, with the gated gauge offering the bull nothing before October 9. The Nasdaq’s window actually turns friendly in August. So let no man tell you the season is what breaks this market; the season merely stops carrying it. That is the stretch where an advance has to walk on its own legs — and this advance has just shown you a double top, a lone Dow flare, and its leader on the floor.
What would prove the top is plain, and it has not printed yet. The June 10 closes are the trap door under this market: 28,554 on the Nasdaq, 7278½ on the S&P. While those floors hold, all of this — the double top, the flipped book, the leader’s slide — is distribution suspected, and a suspicion is not a position. Let the Nasdaq close under its June low and fail to recover it, and suspicion becomes evidence; let the S&P follow through its own floor and evidence becomes a trend. A top is not a moment but a process, and a process is traded at its confirmation, not at its rumor.
The read — one signature on every slip
Step back and look at the whole board at once, because the week’s lesson is not in any single market — it is in the repetition. Wheat makes a one-year high and the men with the grain triple their shorts. Cotton pokes above eighty and is thrown back in two sessions over the deepest commercial short in three years. The S&P walks up to its old high a second time and the book that was long in June meets it there, short. Everywhere the crowd is paying up, the interests closest to the goods are handing over inventory — quietly, weekly, in the one report that publishes their signature. I have said it for as long as I have read a tape: the public buys the move, the trade sells the merchandise, and the reckoning arrives on its own schedule.
But knowing who is selling is not the same as knowing when the price agrees, and the discipline this week is the discipline of the trigger. The grain story wants wheat’s first failure under
- The index story wants the June floors — 28,554 and 7278½ — taken out on closes. The softs are the furthest along, trend and book and season all leaning together, and even there the sugar short carries a September expiry date on his conviction. Nothing on this board rewards the man who anticipates; every card on it rewards the man who waits with his levels marked. The line of least resistance is bending — in the grains, in the softs, in the averages, all in the same direction. I let it snap before I lean on it. Anticipate nothing; weigh everything. The big money is not in the guessing; it is in the waiting.
Informational and educational only — not financial advice. Futures trading involves substantial risk of loss; seasonal and positioning signals do not guarantee future results. Signals and charts: ChartHorizon (local end-of-day data).