Every note on this paper is computed upstream, on ChartHorizon's own research dashboard: end-of-day futures and CFTC Commitments of Traders data, read against the three lights — season, the hedging program, term structure — with the interest-rate bias added across the FX majors. The Weekly Tape, the Hedgers' Ledger and the FX Map are what that board prints when the desk judges a market worth writing about.
Now you run the board yourself — a local-first install that lives on your machine and opens in your browser, the same positioning work set with the same care, only live: every market, every light, on demand.
Every market, every light
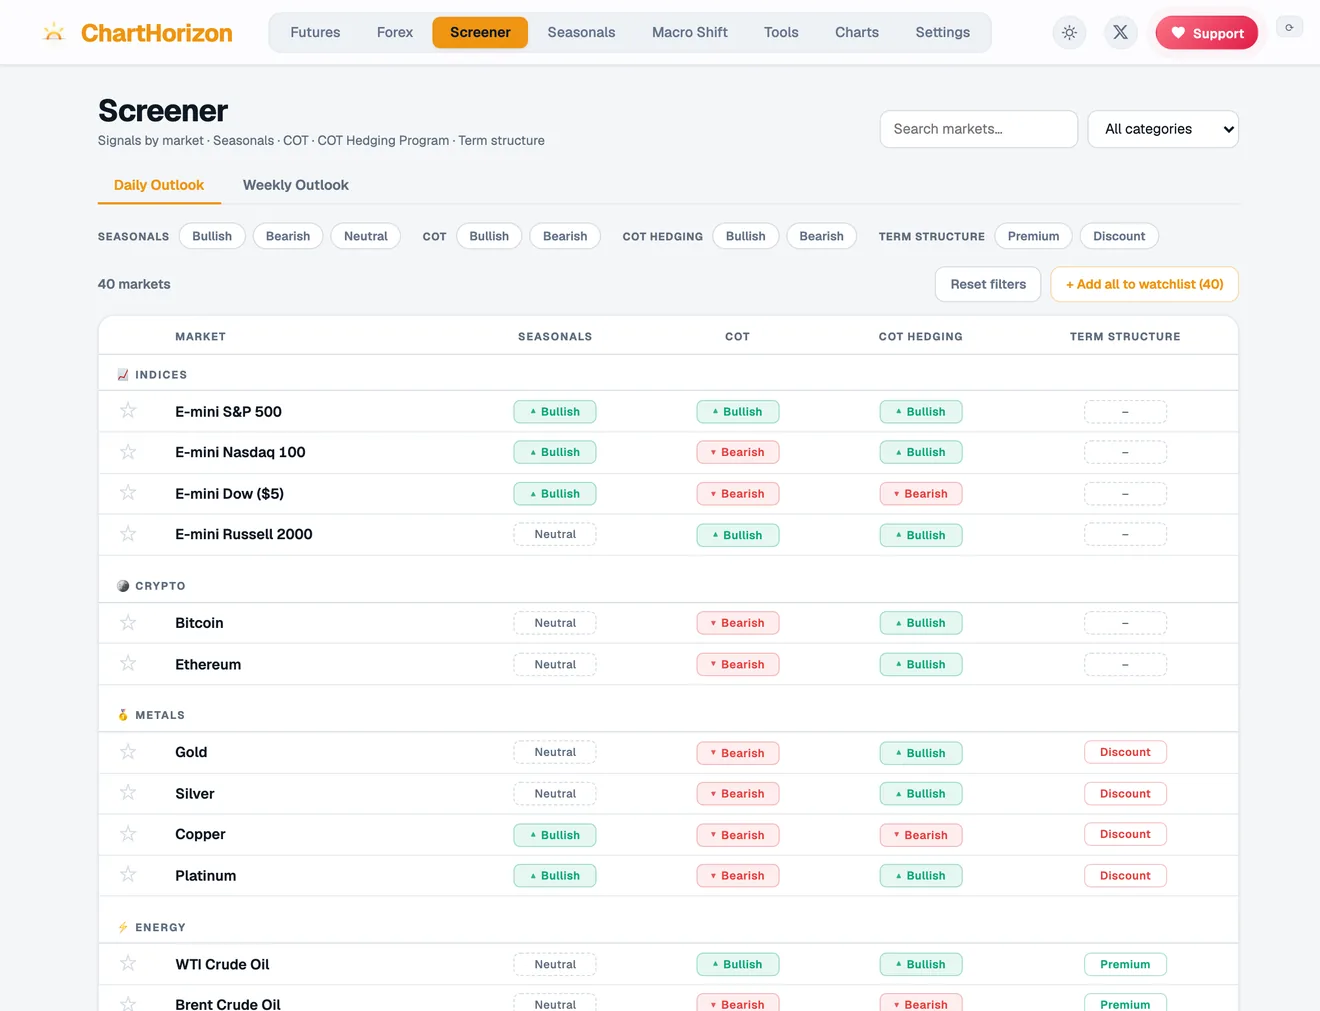
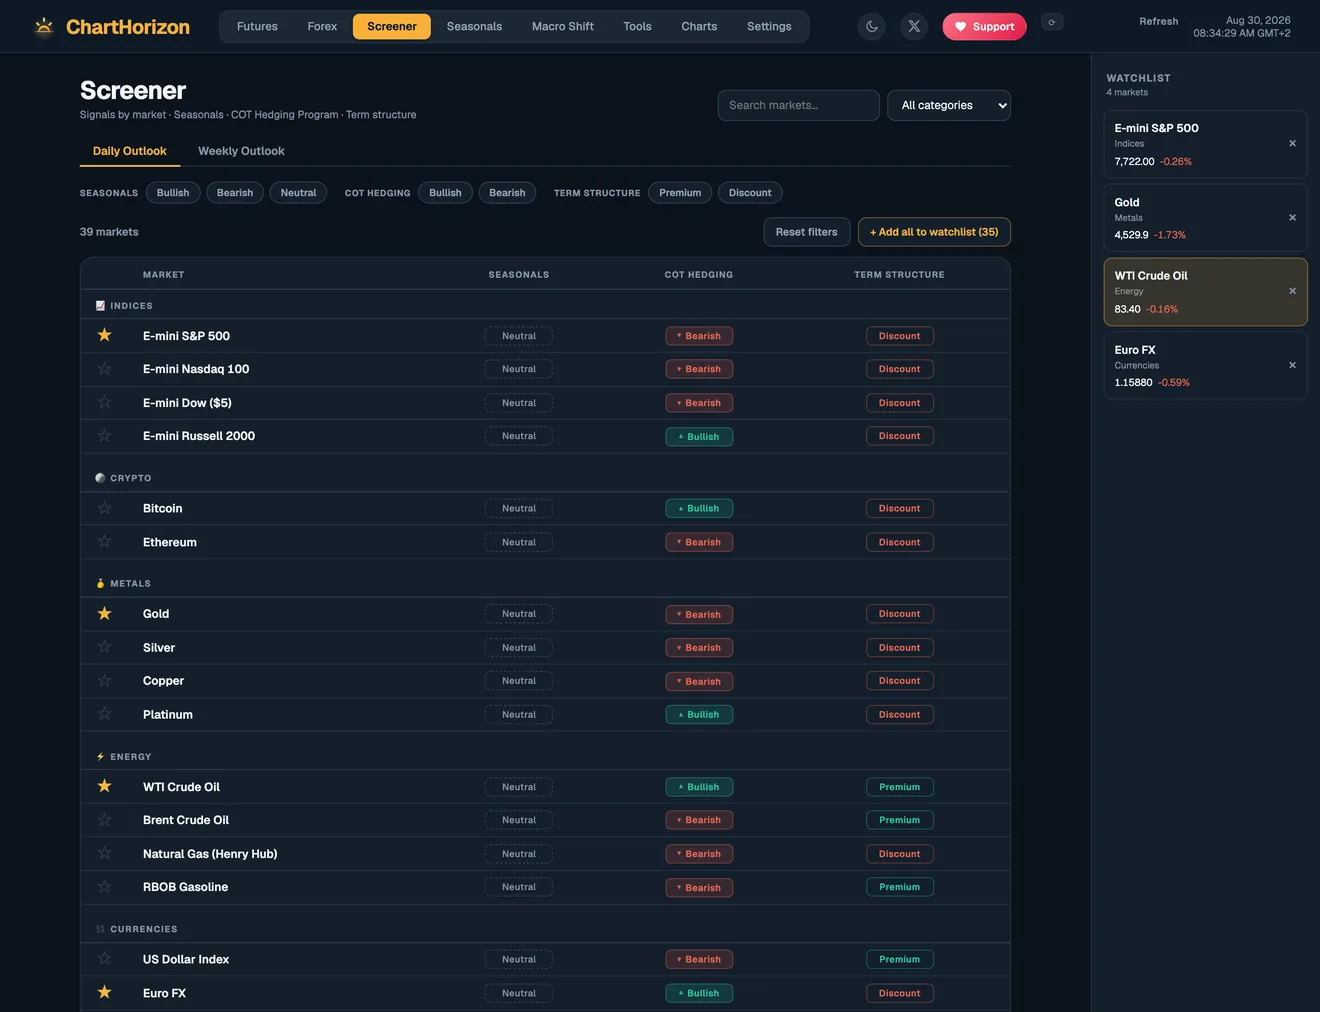
Every futures market on the board scored on the three signals at once — season, the hedging program and term structure — filterable and ranked, the whole desk on a single screen. It's the view that decides which market is worth a note.
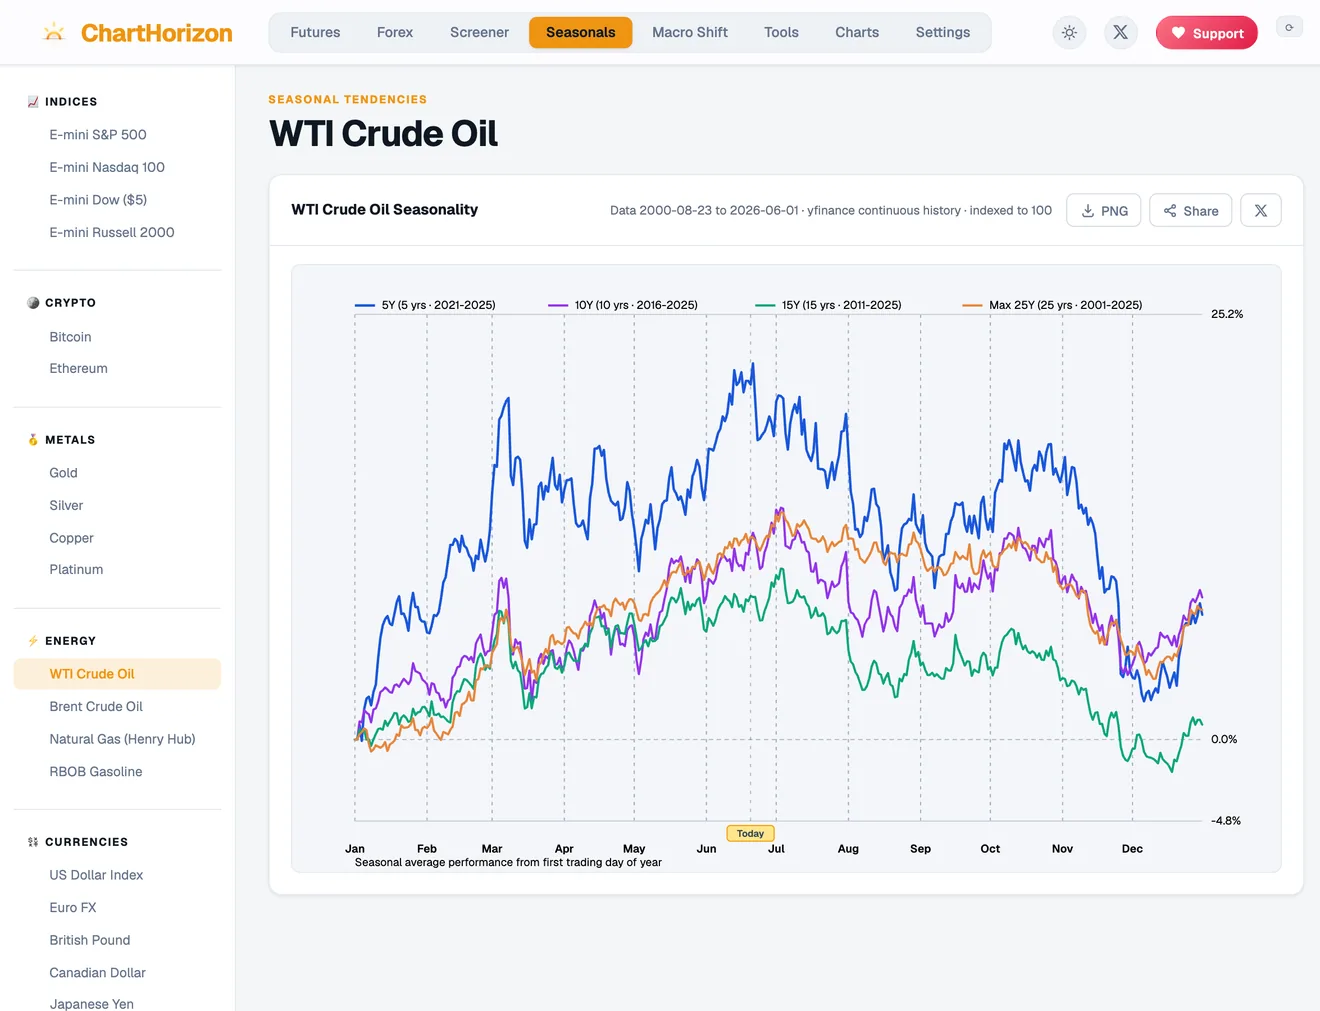
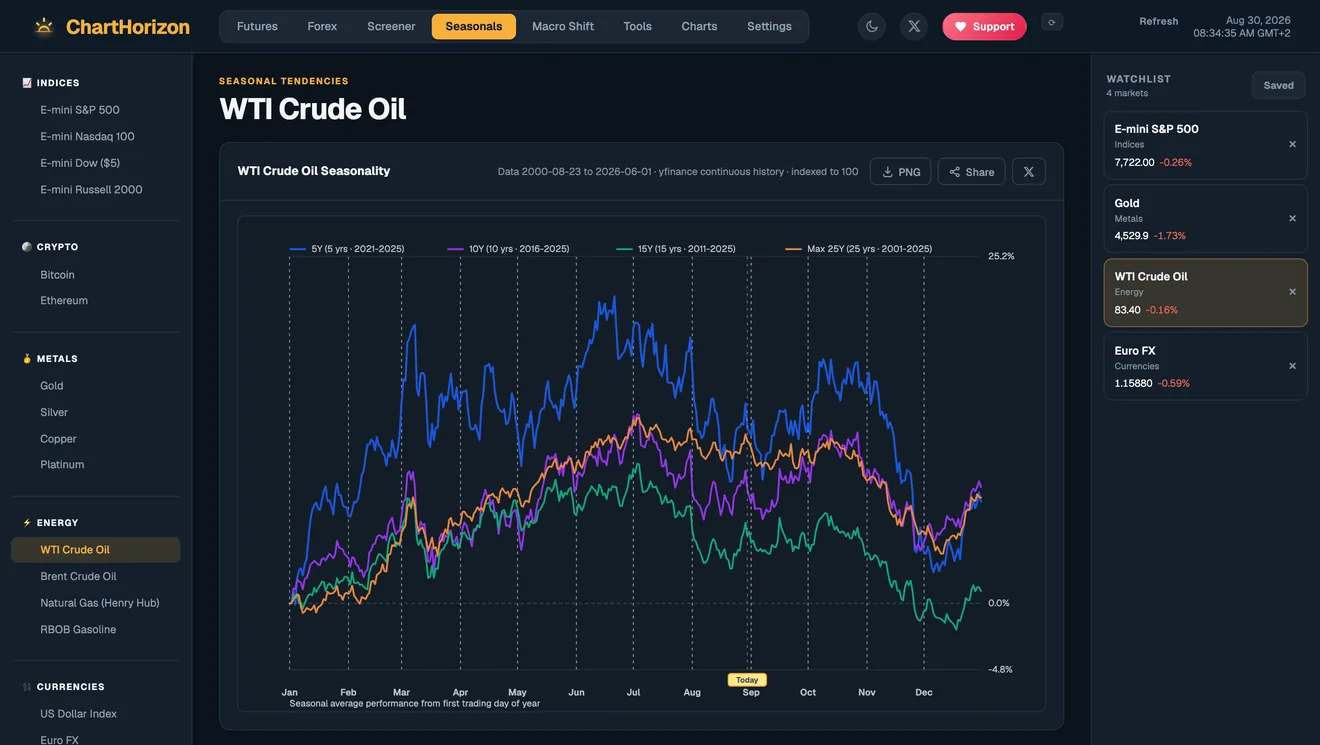
The season, isolated
Years of the same contract folded onto one calendar, so a market's seasonal tendency stands clear against where price actually sits this year — the first of the three lights, read on its own terms.
Cross-asset, side by side
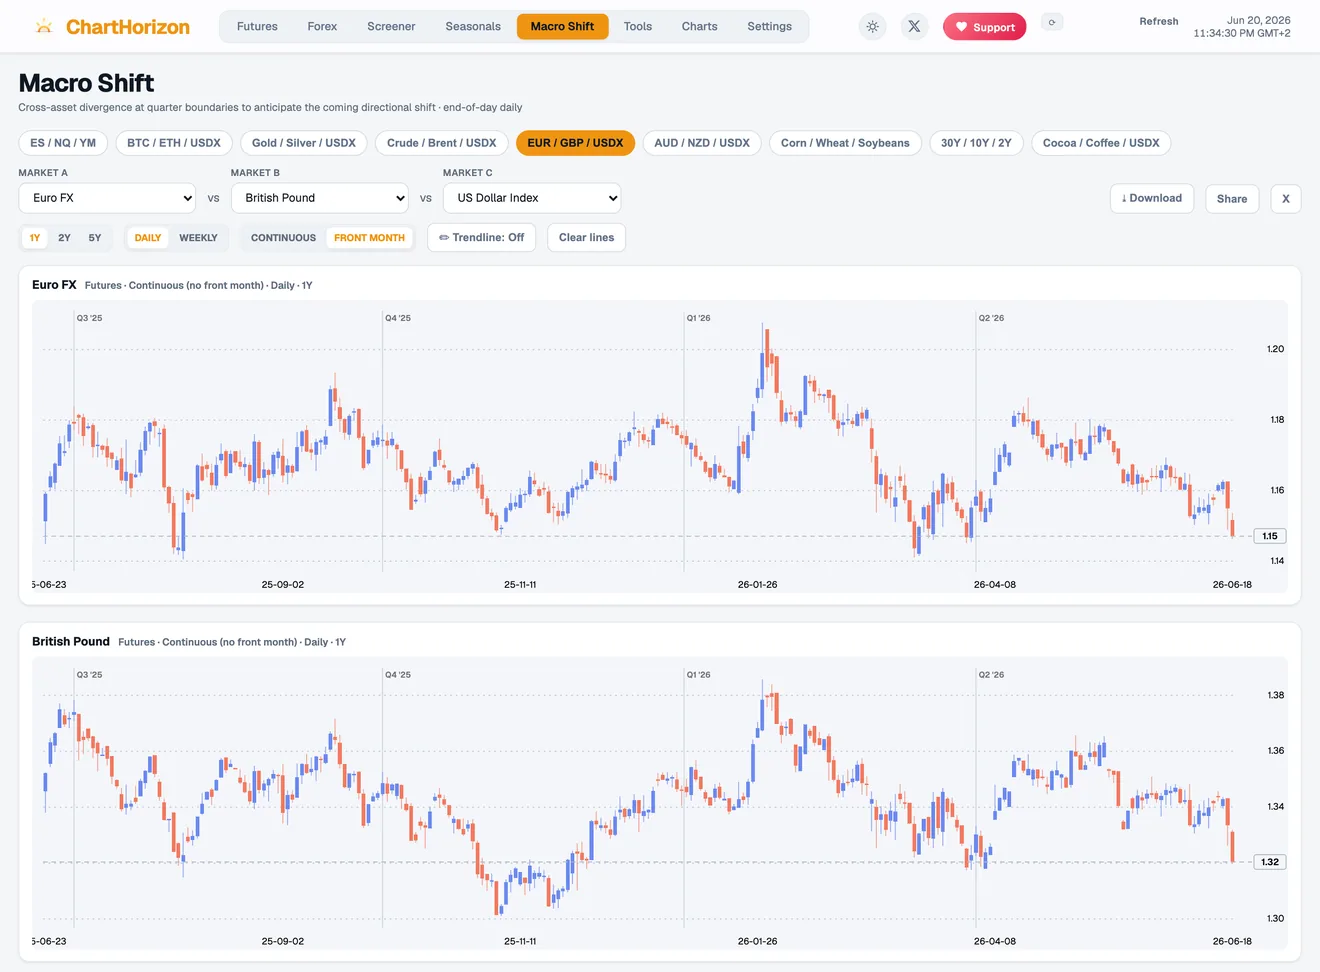
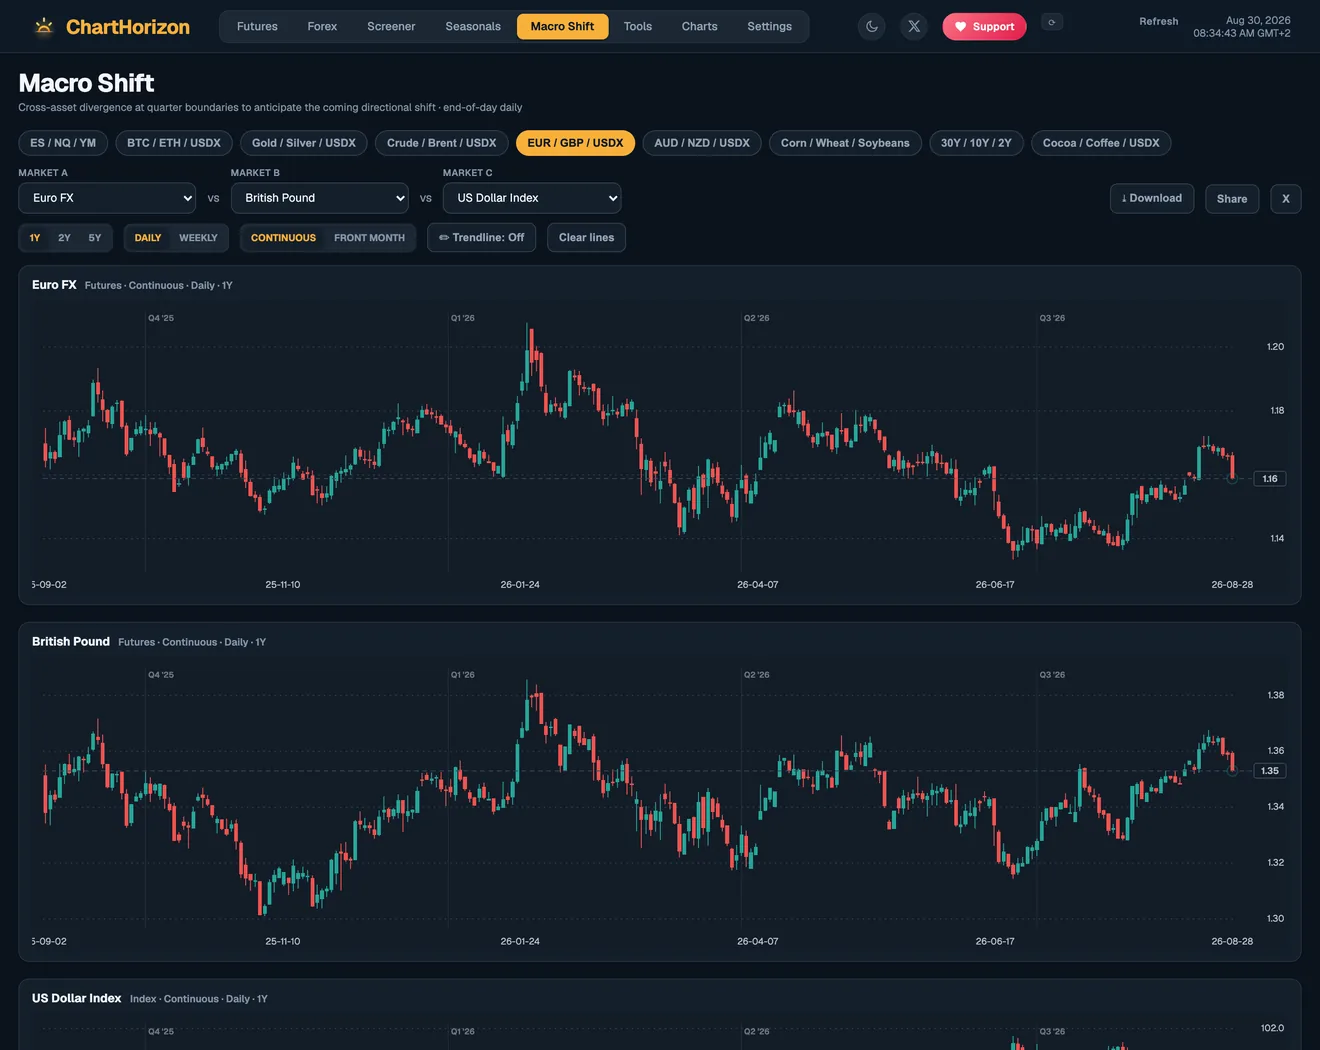
Three markets on one timeline — the euro against sterling against the dollar; equities against bonds — so a divergence between things that usually move together shows up before the turn does. Quarter boundaries marked, the lines yours to draw.
Down to the candle
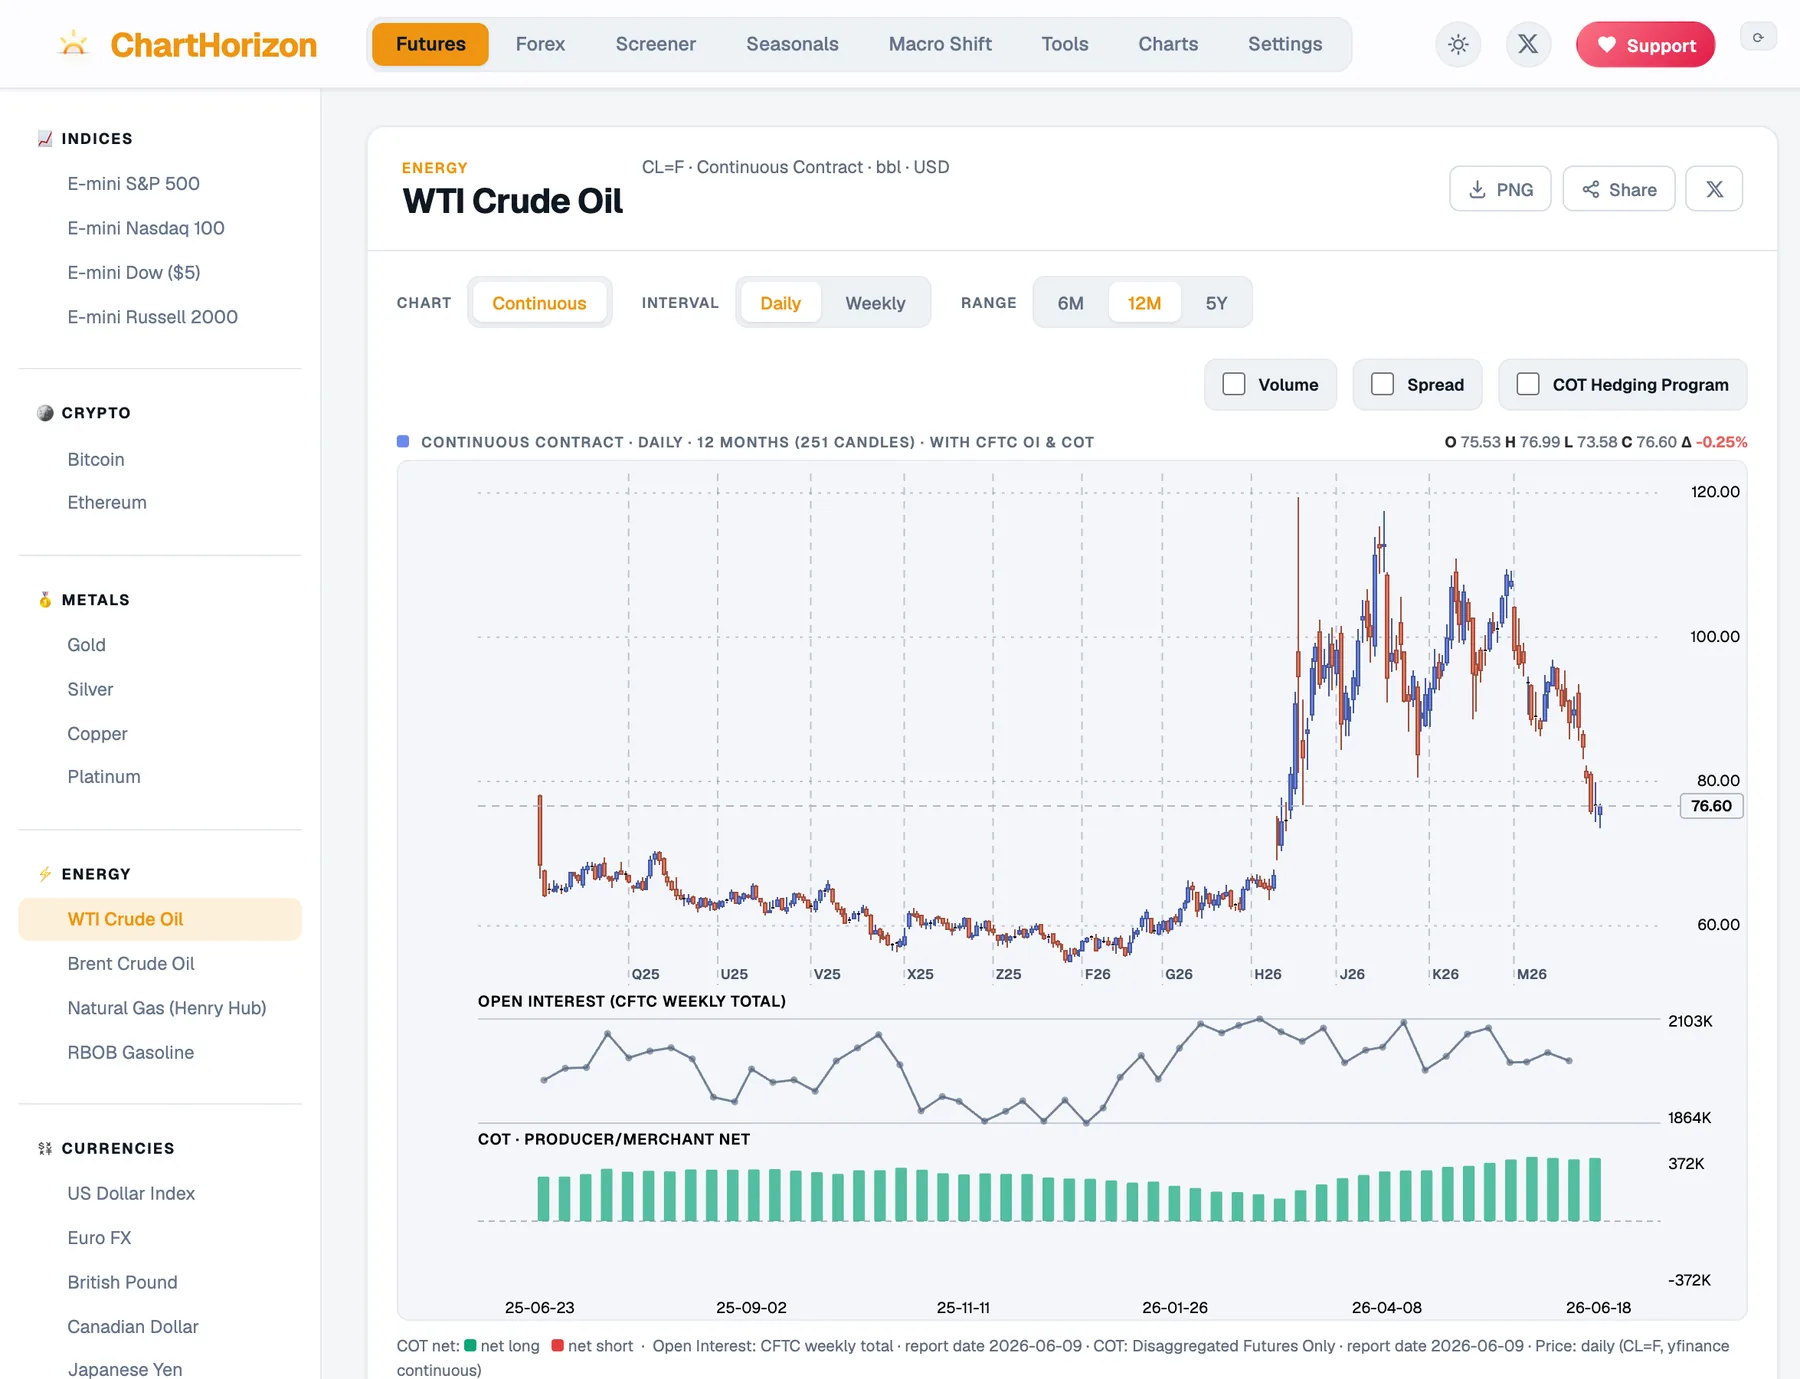
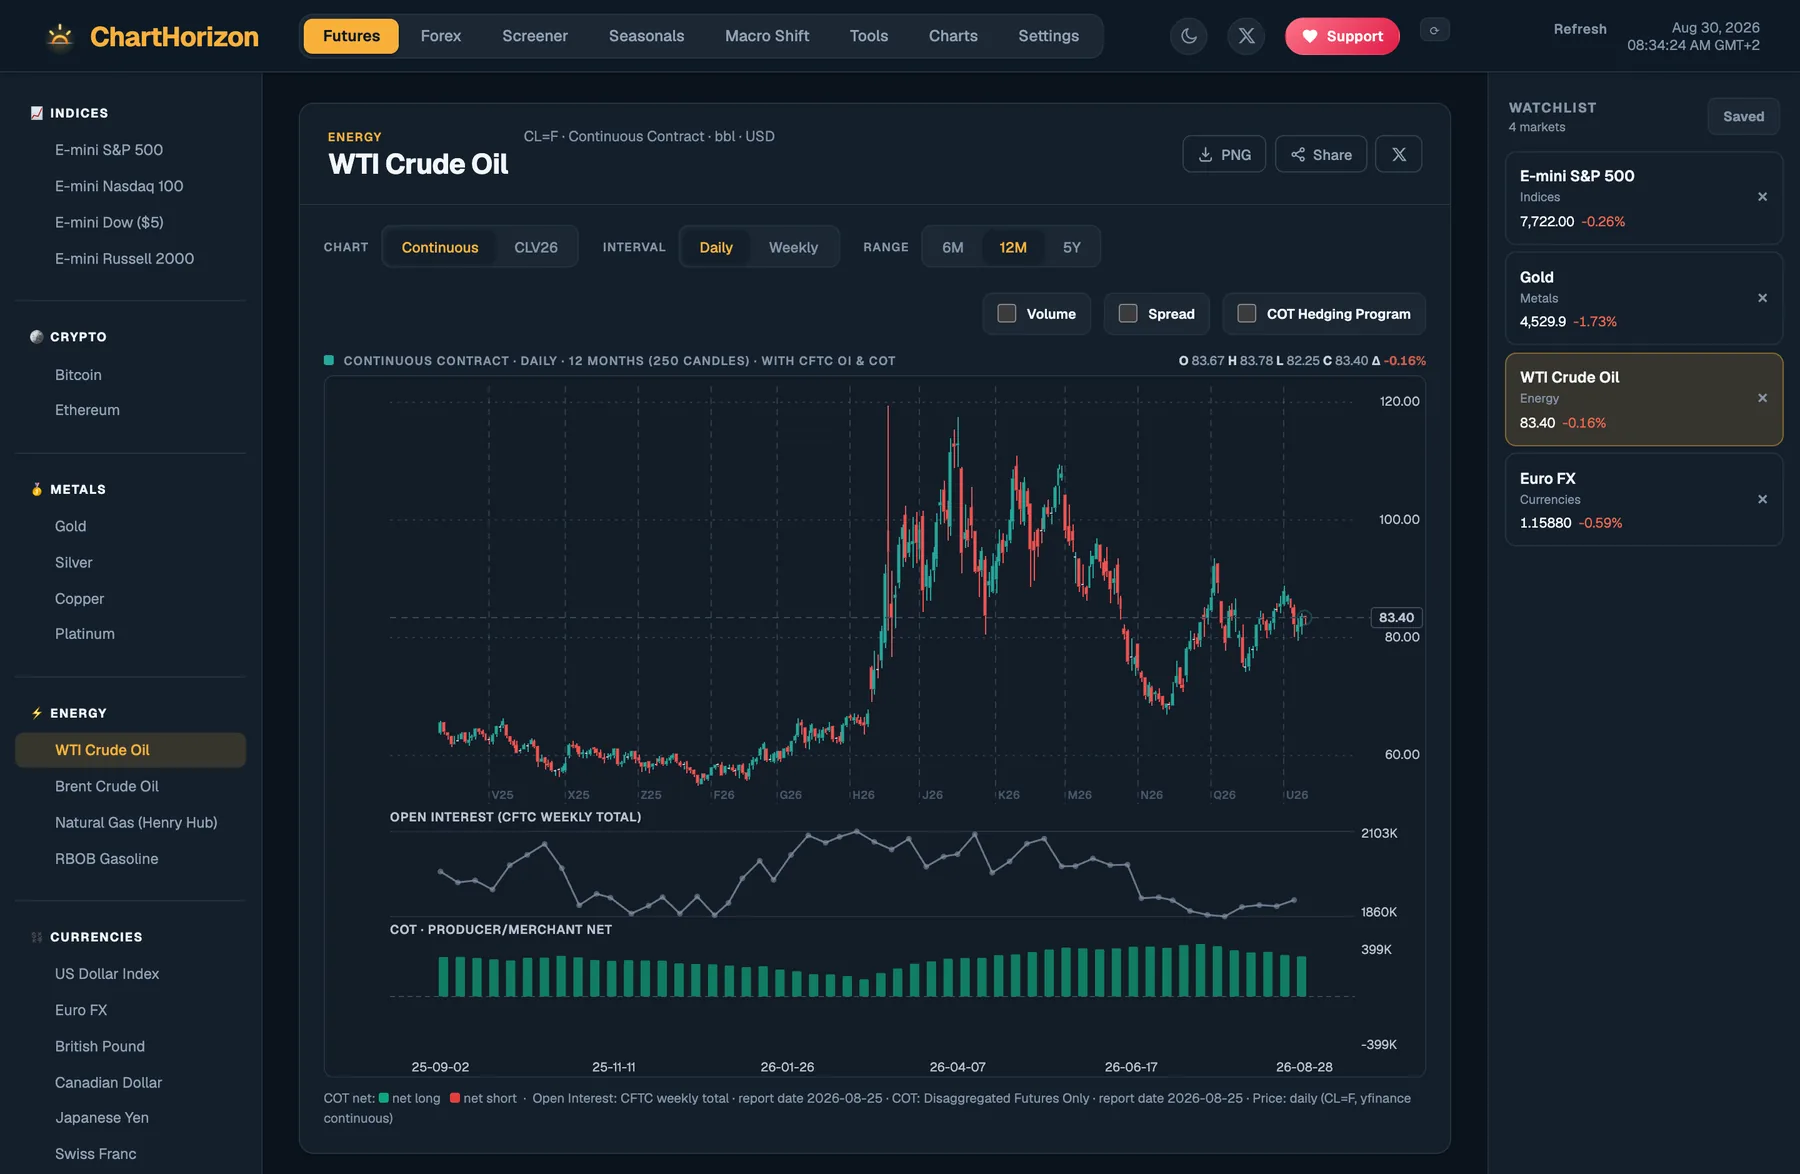
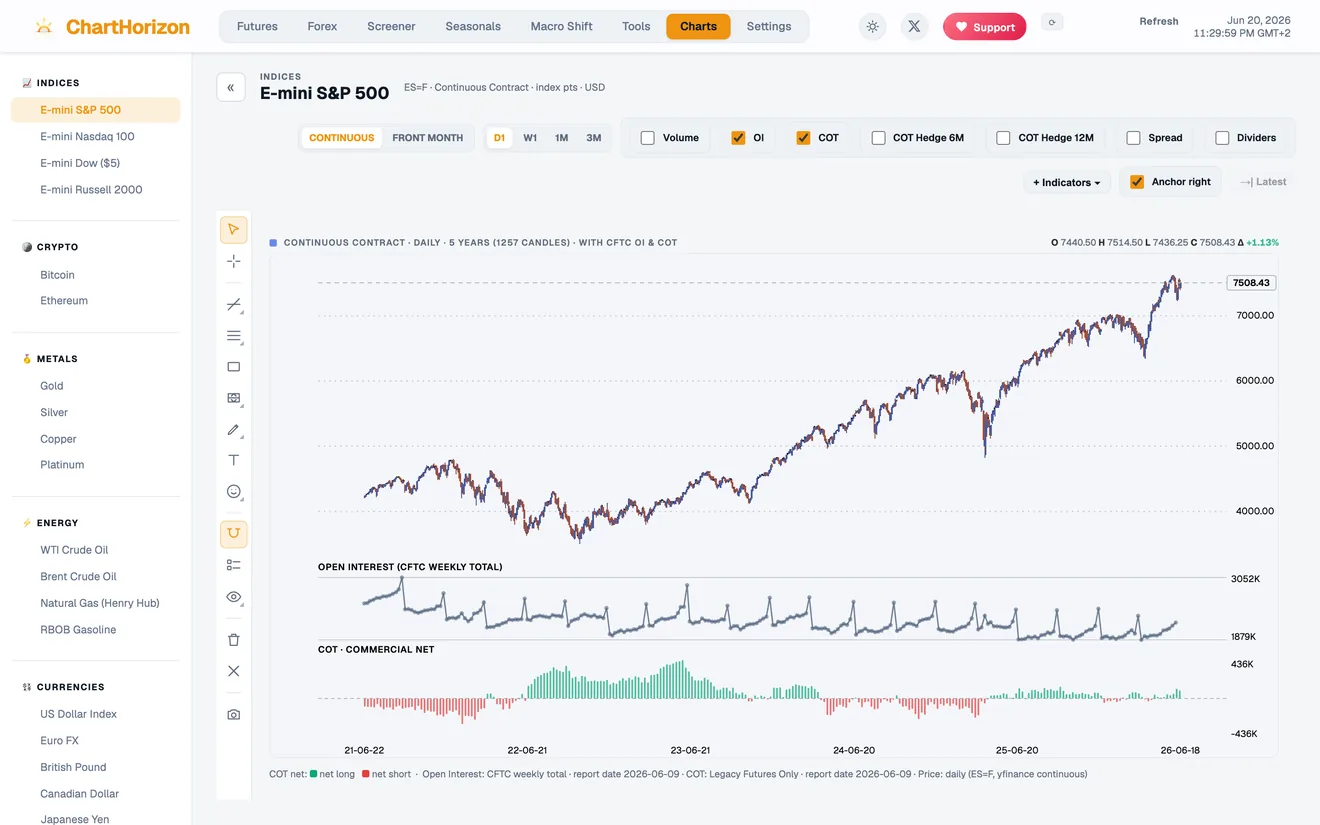
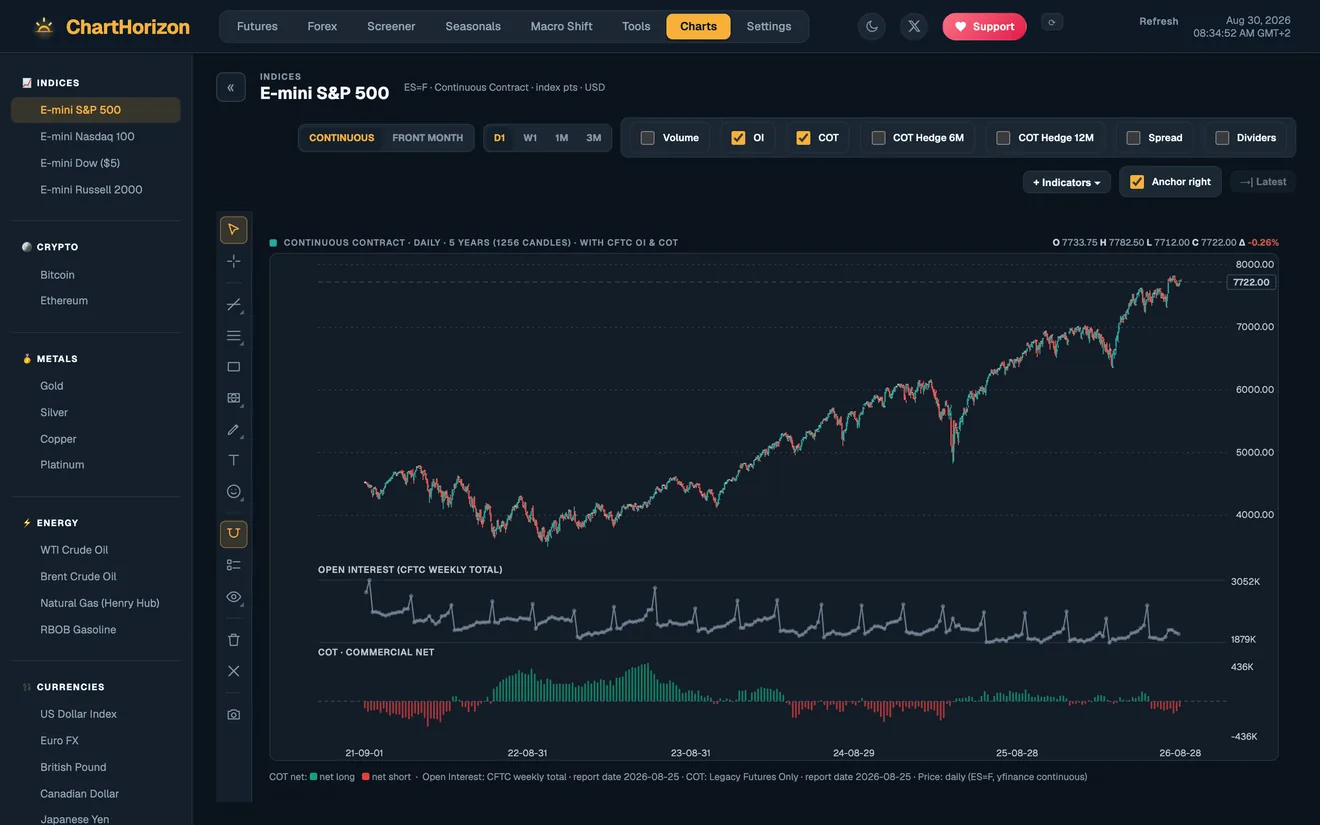
Every contract as a full chart — price, open interest and the commercials' net on one pane, years deep, with drawing tools to mark up what you see. The same data the notes are built on, open to your own read.
The board is ready. Pick your platform below.
Not code-signed yet, so your system may warn the first time you open it.
Opening it the first time
One step on each system gets it running:
- macOS — drag ChartHorizon onto Applications, then right-click (or Control-click) the app and choose Open → Open. If macOS still calls it “damaged,” clear the quarantine once:
xattr -cr /Applications/ChartHorizon.app. - Windows — on the SmartScreen prompt, click More info, then Run anyway.
- Linux — make it executable:
chmod +x ChartHorizon-*-x86_64.AppImage, then run it. If it reports “AppImages require FUSE,” installlibfuse2or run it with--appimage-extract-and-run.
Open source under the AGPL-3.0. The code behind v1.3.1 is on GitHub.
Local-first by design: no account, and your data never leaves your machine. Something broken, or working well? The desk reads its mail at @ChartHorizon.