Priced to Pass
The Fed raised rates into $100 oil on Wednesday, while the futures market priced December 2027 crude almost thirty dollars below October's.
Prices through 16 September 2026 · COT through the 8 September report · Data: ChartHorizon, CFTC, CME Group, U.S. Treasury, Federal Reserve, FRED & press reports · Charts: ChartHorizon
On Wednesday afternoon the Federal Reserve raised its policy rate for the first time since July 2023, by a quarter point to 3.75–4 per cent, on a unanimous vote. That day the October WTI crude contract settled at $102.43 a barrel. The December 2027 contract settled at $72.55.
Those two prices are this note. The first is what oil costs now, in a war that has cut most of the traffic through the Strait of Hormuz and, since last Friday, the Saudi pipeline that goes around it. The second is what the same barrel costs for delivery fourteen months later, and it is almost thirty dollars cheaper. The Fed acted in a week dominated by the first. The futures market has already priced the second.
That is less of a disagreement than it looks, and the reason is the useful part.
The week the pipeline closed
The shortage is real. On 8 September the US military said it had destroyed five Iranian tankers near Jask and Kharg Island after missile attacks on a Navy warship. Iran fired ballistic missiles toward US targets in Jordan, whose military said it intercepted 18 of them. On 10 and 11 September drones launched from Iraqi territory hit pumping stations on Saudi Arabia’s East-West pipeline, the 1,200-kilometre line that carries about five million barrels a day from the eastern fields to the Red Sea port of Yanbu. It is the kingdom’s way around Hormuz, and Riyadh shut it on the 11th as a precaution.
Rystad Energy put the loss at three to five million barrels a day of exports and priced the problem by how long it lasts. One month means 78 to 120 million barrels, which inventories and deferred cargoes can cover. Three months means 230 to 360 million, which, Rystad said, “cannot be replaced solely through spot market reallocation”. On Wednesday Saudi Aramco was reported to be working around the damaged section, aiming to restore about half the capacity within days and all of it in roughly six weeks. The same morning the Energy Information Administration reported a crude draw of 640,000 barrels.
The October contract went from $96.05 on 9 September to $102.48 on the 10th, touched $106.75 on Tuesday, and gave back 3.2 per cent on Wednesday. On 10 August it had stood at $81.16. Retail diesel set a record of $6.06 a gallon on 11 September.
What the Fed said, and what it left out
The statement never mentions oil. It says uncertainty “remains elevated owing, in part, to geopolitical developments”, that “inflation remains elevated”, and that the increase “will support a timelier return to the Committee’s 2 percent goal”. Chairman Warsh was more specific in his opening remarks. He recalled saying at Jackson Hole that commodity prices “bear watching”, noted that “the prices of many of these key inputs have risen” since July, and set out what the Committee means to ensure: “that relative price changes in some sectors of the economy do not broaden, that inflation compensation in market prices stays low, and that inflation expectations remain well-anchored.”
Nothing on that list is the price of oil. A central bank cannot pump a barrel. What it can do is stop a rise in one price from becoming a rise in all of them, and keep the market’s long-run price of inflation where it is, and Warsh named that market price as a yardstick.
The projections published alongside put total PCE inflation at 3.7 per cent this year and 2.3 per cent next, with the median funds rate at 4.1 per cent at the end of this year and unchanged through next. Sixteen of eighteen participants expect at least one more increase. The Fed’s own forecast, in other words, has the shock passing too. It raised rates anyway, as insurance on that forecast.
What the curve is pricing
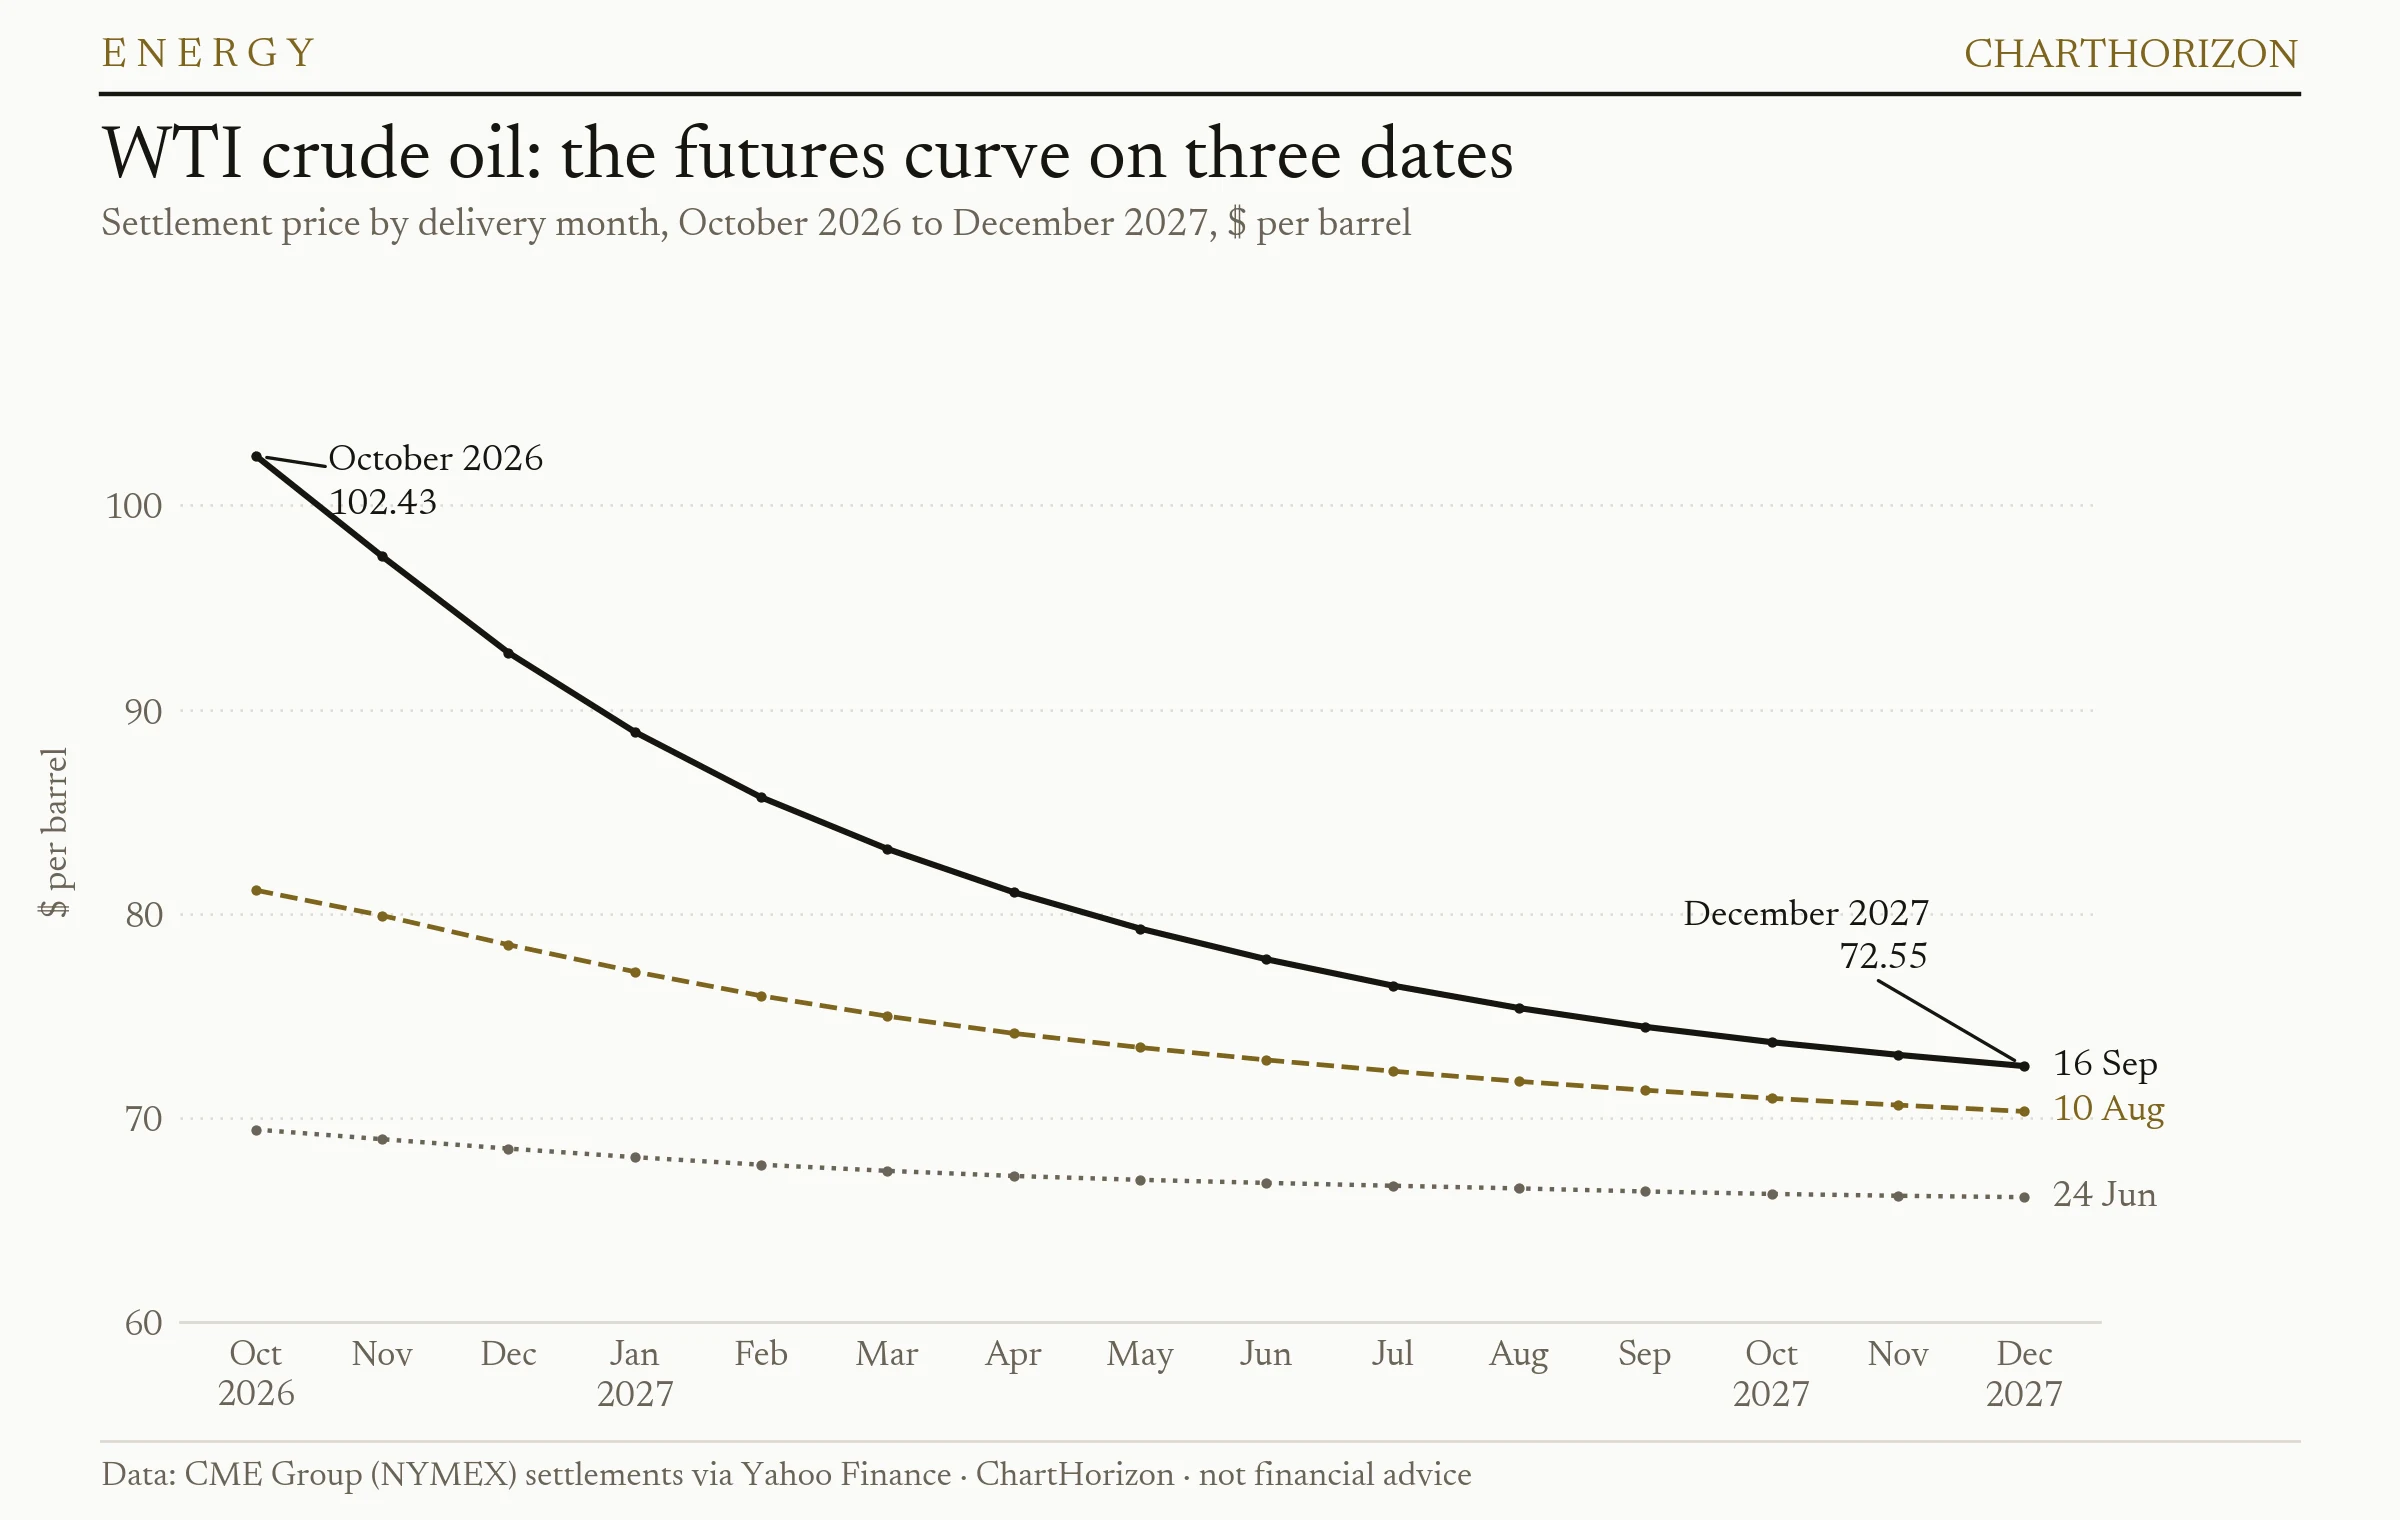
On 24 June, with the front contract near its low for the summer, the whole strip from October 2026 to December 2027 sat within $3.31: $69.44 at the front, $66.13 at the back. On 10 August the gap was $10.83. On Wednesday it was $29.88.
Since 10 August the October contract has gained $21.27, or 26 per cent. March 2027 has gained $8.19. December 2027 has gained $2.22, or 3 per cent. Nearly all of the rally sits in barrels that can be delivered before the year is out, and the further along the curve you look, the less of it there is.
A futures curve is not a forecast, and this one should not be read as a promise. It is a row of prices at which barrels for different months change hands today. A curve this steep mostly says that a barrel in the tank now is worth far more than a barrel next year, which is what a market says when it is drawing down inventories to cover a hole. But the back of the curve is also the price at which a producer can sell next year’s oil today, and at which a refiner or an airline can buy it. On Wednesday the twelve contracts of calendar 2027 averaged $78.47. Nobody with 2027 barrels to sell or to buy was being offered $100.
The desk’s term-structure light shows the same thing one step along the curve. The spread between the December and January contracts widened from $1.50 on 12 August to $4.49 on Tuesday, and was $3.88 on Wednesday.
The bond market’s version
Warsh’s “inflation compensation in market prices” has a public series. The five-year, five-year forward inflation expectation rate, which the St. Louis Fed derives from Treasury yields, measures what the bond market charges for inflation between five and ten years from now.
It stood at 2.33 per cent on 10 August and at 2.31 on Wednesday. Across the whole of this rally in oil, it barely moved. The five-year breakeven, which covers the nearer years and so takes in the shock itself, rose from 2.25 per cent to as high as 2.46 on 10 September, and was 2.35 after the hike. The bond market expects more inflation for a while and no more than before in the long run, which is the curve’s reading in another market.
There is a caveat, and it is the best argument the Fed has. The same forward rate stood at 2.05 per cent on 30 March, when the front WTI contract settled at $102.88. On Tuesday it reached 2.35, its highest this year. It barely moved with this month’s oil, but it has risen thirty basis points since the spring, with oil at about the same price at both ends. That drift is exactly what “inflation expectations remain well-anchored” is about, and it is a better reason for Wednesday’s hike than the price of a barrel. The hike’s first day took four basis points off it.
Who sold forward
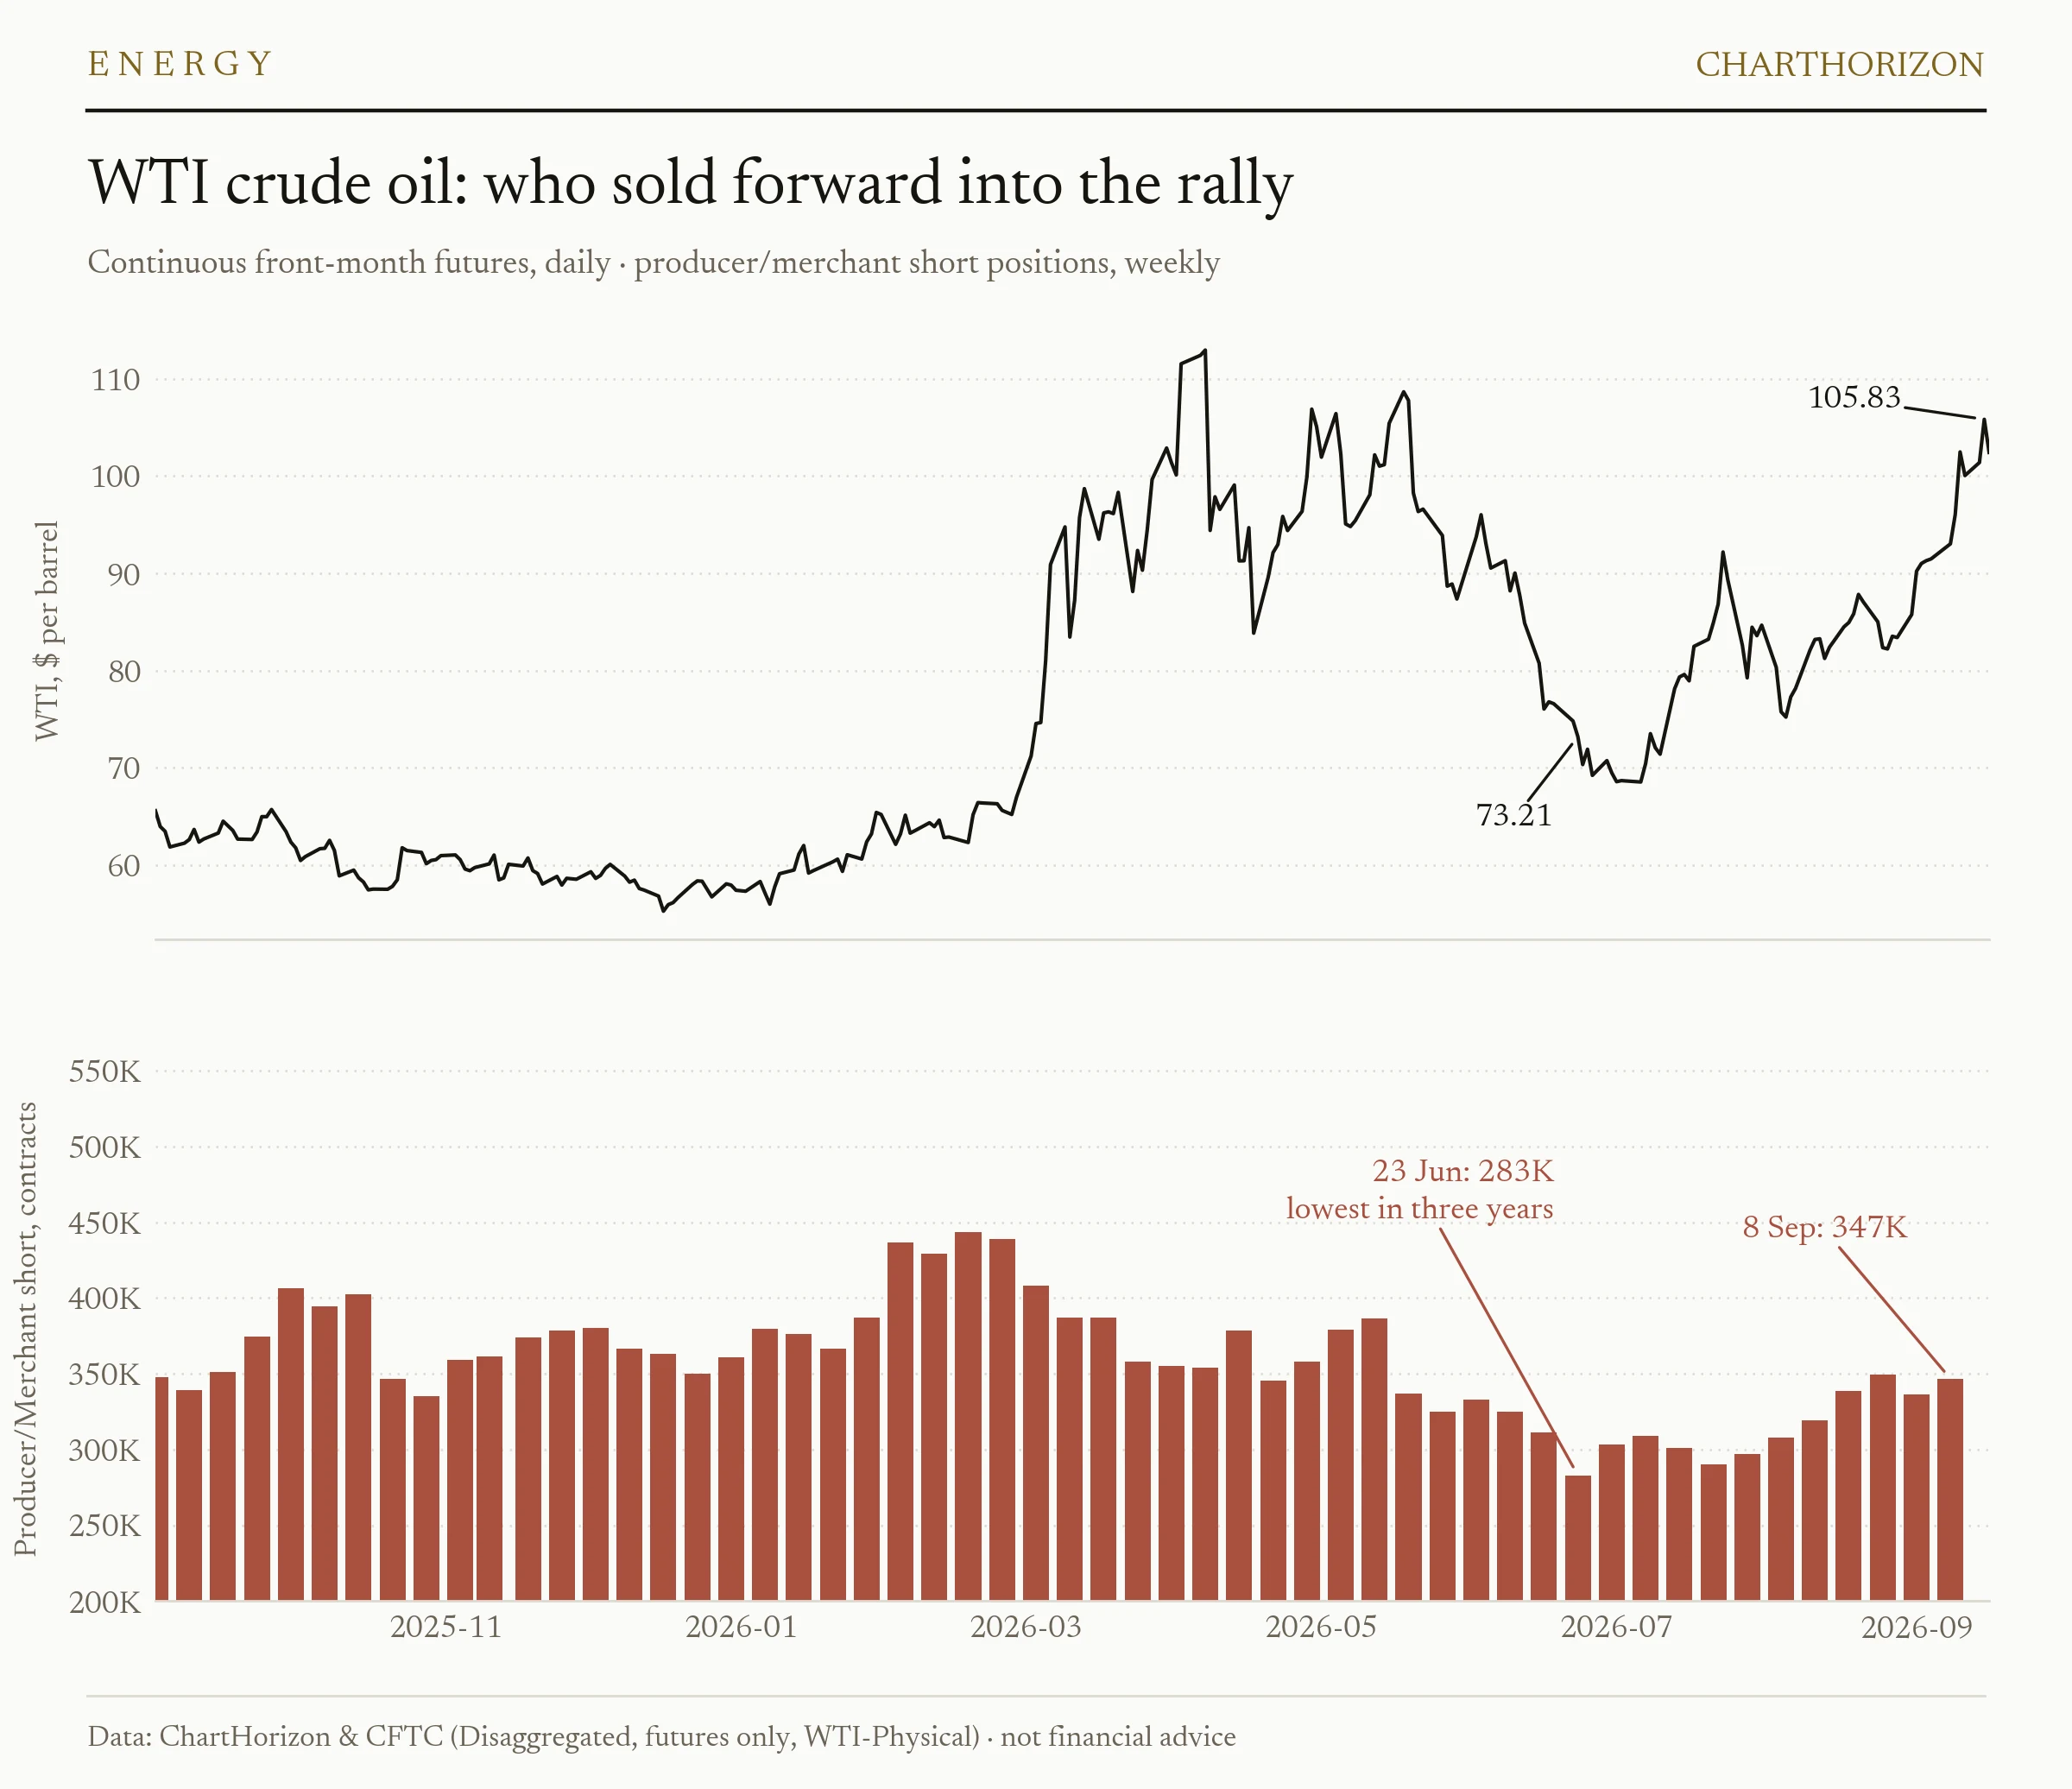
If the back of the curve is the price producers can lock in, the commitments report shows whether they took it. In WTI they did, without hurrying.
The producer/merchant short book, which holds the hedges of the firms that pump, store and ship the oil, stood at 283,032 contracts on 23 June. That was its smallest in the three years of the desk’s archive, with the front contract at $73. In the report dated 8 September it had grown to 346,775, an increase of 63,743. That is still only the 26th percentile of three years; in May 2024 the same book held 472,761. The long side of the same group fell from 700,107 contracts in mid-July to 655,691, and the net position, a three-year high of 399,298 contracts long on 14 July, is down to 308,916.
So the producers sold into the rally, as producers do, and the prices they sold at are the ones on the right of the curve chart, not the left. They sold less than they have in other years. The report records how much they sold, not why they held back.
Mind the timing. The report is dated Tuesday 8 September, before the pipeline was hit and before the October contract settled above $100 on the 10th. The report dated 15 September, published on Friday, is the first to show what the hedgers did at $100.
In gasoline, where the hedgers are the refiners, the selling was heavier. Their net short reached 102,029 contracts, the deepest since 3 March and the 8th percentile of three years.
Before this week
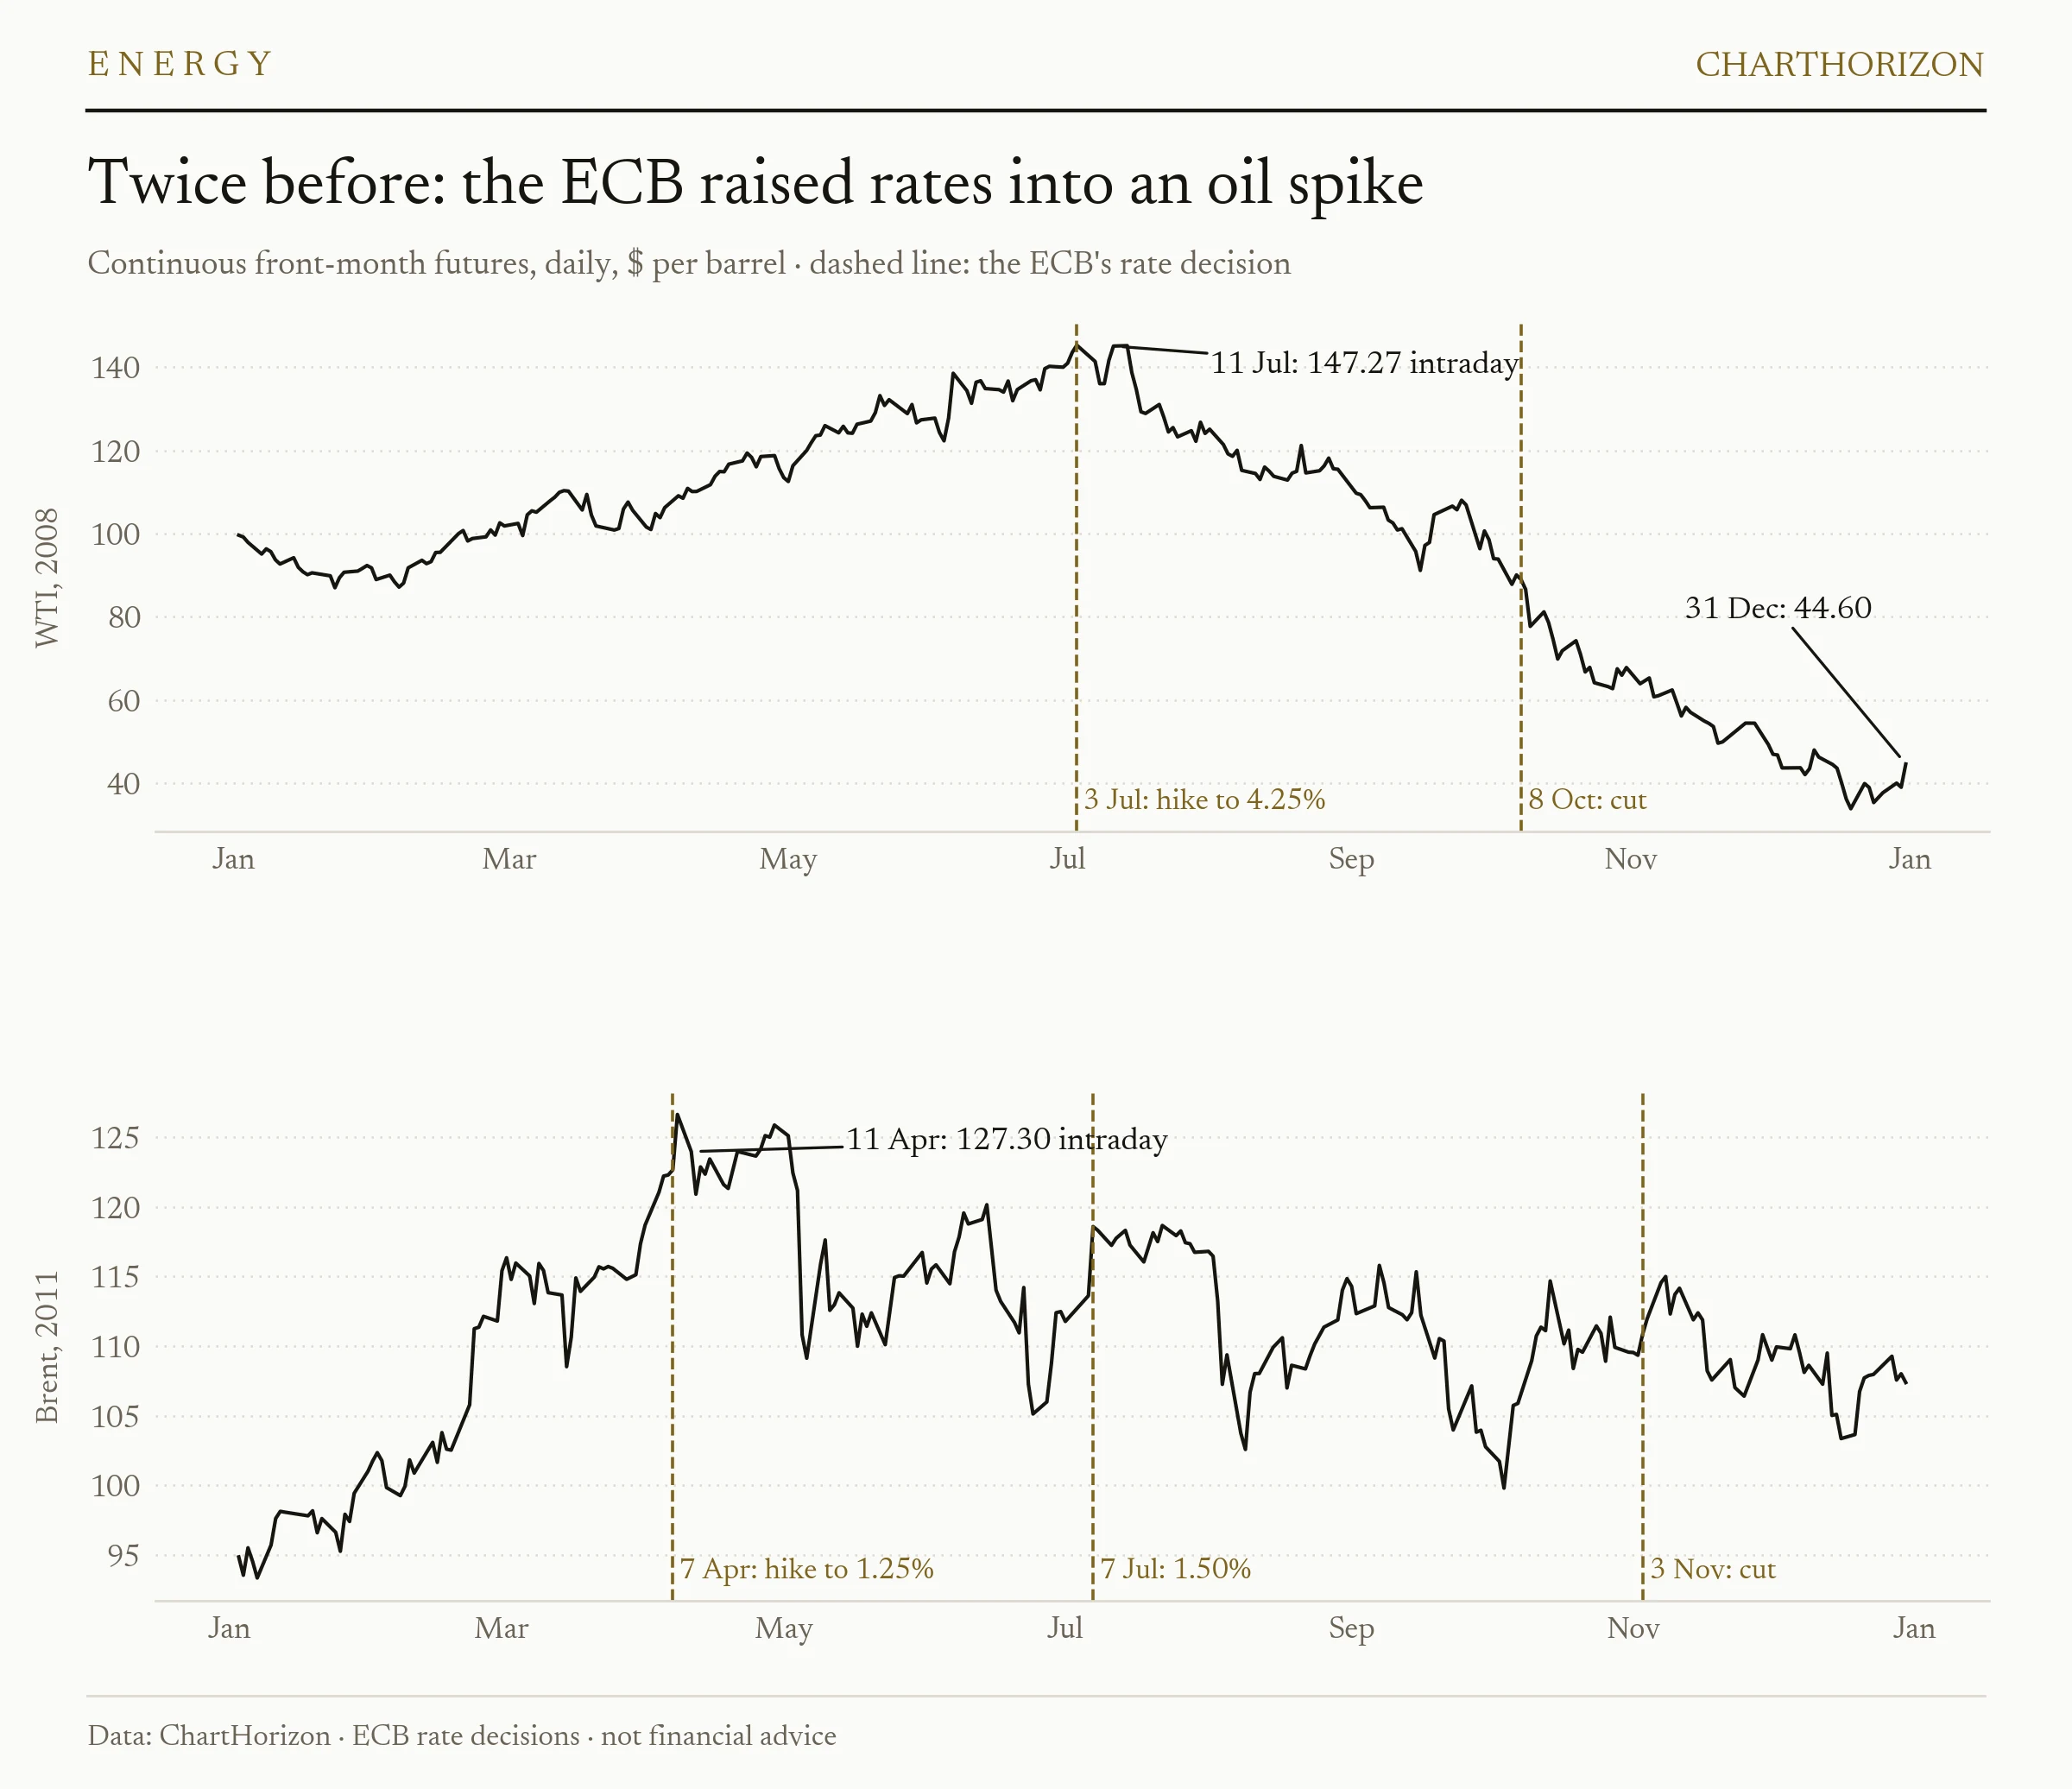
Central banks have raised rates into oil spikes before, and the desk’s price archive holds three such cases, two from the European Central Bank and one from the Fed.
On 3 July 2008 the ECB raised its main rate to 4.25 per cent, with WTI at $145.29. Eight days later, on 11 July, WTI traded at $147.27, which is still the record. It ended the year at $44.60, and the ECB was cutting by 8 October.
On 7 April 2011 the ECB raised its rate to 1.25 per cent, pointing to energy and commodity prices, with Brent at $122.67. The next day Brent settled at $126.65, its highest close of the year, and on 11 April it traded above $127. The ECB raised again in July, and in November it began taking both increases back.
The Fed’s own case is March 2022, and it fits less neatly. The Fed raised rates on 16 March, its first increase since 2018, with WTI at $95.04, nine days after the front contract had traded $130.50 in the wake of Russia’s invasion of Ukraine. The spike had topped, but the shock had not passed: WTI settled at $122.11 on 8 June, and by the time it ended the year at $80.26 the Fed had raised rates six more times.
Three episodes prove nothing. This desk once tested a seasonal claim across 5,026 market-months before it would print a conclusion, and three cases come nowhere near that. They make a narrower point. A central bank that responds to a price spike responds to a price that is already there. Twice the spike was within days of its top; the third time it had topped nine days earlier and came back three months later. This year has its own example without any central bank in it: WTI settled at $112.95 on 7 April and at $83.85 on 17 April, the day Iran declared the strait open, and traded below $70 on 24 June.
What last week got wrong
Last Saturday’s note, Failure to Confirm, set five tests for a turn in the summer’s trade and promised to report back. Three have failed, one is holding, and one has not happened.
- The ten-year yield stays under 4.98 per cent. Failed. It closed at 5.00 on Tuesday and 5.01 on Wednesday, above its October 2023 peak.
- November soybeans stay under 1335¼. Holding. The contract reached 1332¼ on Wednesday.
- The dollar index cannot make a higher high once the Bank of Japan has delivered. Failed before the Bank of Japan had even met: the December contract traded 100.085 on Wednesday, through 99.555.
- The Nasdaq 100 holds its 2 September low through Wednesday. Failed on Monday, when the September contract traded 28,816¼, under 28,927¼.
- Oil follows the grains, with Brent back under $100. Not met. November Brent’s lowest trade this week was $104.06, on Wednesday.
Within three sessions the divergences resolved in the direction of the trend. The plain reading is that the note mistook a pause for a refusal. Its closing point does stand: the one market that had not joined the turn was oil, and oil is the market the Fed has now answered.
What would change this read
Four things, each with a number attached.
- The back of the curve stays put. December 2027 WTI is $72.55. If it climbs through $80 while the front holds, the market has started pricing a longer shock, and the insurance the Fed bought on Wednesday becomes the main policy.
- The long-run inflation rate stays below its high. The five-year, five-year forward was 2.35 per cent on Tuesday. A close clearly above that says the hike did not buy what it was meant to.
- The spread narrows when the pipeline returns. Aramco expects half the capacity back within days. If the pipeline runs again and the December-January spread does not fall back toward the $1.50 it showed in August, the shortage is not the pipeline’s.
- The hedgers sell at $100. If the report dated 15 September shows the producer short book well above 346,775 contracts, producers treated the rally as a price to lock in, which is the most direct statement a market participant can make about how long it expects a price to last.
One practical note. The October WTI contract expires on 22 September. On continuous charts, including the price panel of the second chart above, the series then switches to November, which settled $4.92 lower on Wednesday. That will look like a fall on the day. It will not be one.
The read
Oil at $100 is a fact about this autumn. The curve, the Fed’s own projections and the bond market’s long-run inflation rate all say, each in its own way, that it is not yet a fact about 2027. Wednesday’s hike was meant to keep it that way, and Warsh said which market price he will be judged by.
The risk to that sits at the back of the curve, not the front. A front-month contract can lose $29 in eight sessions, as the front contract did in April, and the case for the hike would weaken with it. A December 2027 contract that starts to follow the front would be the market’s way of saying the shock has stopped being temporary, and every reading in this note would change with it.
Informational and educational only — not financial advice. Futures trading involves substantial risk of loss; seasonal and positioning signals do not guarantee future results. Signals and charts: ChartHorizon (local end-of-day data).