The Calendar Had No Vote
Crude was supposed to fall in August and rose. Tested across 5,026 market-months since 2006, the move after a failed season is slightly smaller, not larger.
Prices through 21 August 2026 · 35 markets tested over 2006–2026 · a seasonality note · Data: ChartHorizon & press reports · Charts: ChartHorizon
Crude oil is supposed to fall in August. Not as a hunch — as a record. Over the twenty Augusts in this desk’s archive, WTI has ended the month lower in thirteen of them, for an average of −2.60 per cent. Brent is much the same: down in thirteen of nineteen, average −1.38 per cent. Refinery runs come off their summer peak, the driving season winds down, and the front of the curve tends to sag.
This August, WTI settled at 87.06 on the 21st against 84.67 at the end of July. Brent went from 79.36 at its low on the 4th to 94.39. Measured from the low rather than the turn of the month, crude has put on sixteen to nineteen per cent in a fortnight, in the month it is meant to give ground.
So the seasonal broke. The question a reader sent this desk after the second week of it is the one worth an answer, because it is a piece of trading lore old enough that most people have stopped checking it: when a market refuses to do what it is supposed to do, does it then do the opposite twice as hard?
The short answer is no. The longer answer is more useful, and it starts with why this particular season broke, because that turns out to be the whole point.
What actually happened to crude
Nothing seasonal. The Strait of Hormuz has been shut since late February, when the US–Israel war on Iran began and Iran blockaded the chokepoint. Flows through it are running at seven to nine million barrels a day against roughly twenty before the conflict; on one day this month ten vessels made the transit, where the pre-war norm was about a hundred and thirty. That is the market crude has been trading all year, and it has nothing to do with driving season.
What moved prices within August was the changing odds on that ending. In the first days of the month the market was pricing a deal: Iran was reported to be close to an agreement with Oman, brokered with Turkish and Qatari help, with a sixty-day trial period for shipments under discussion. Crude sold off into it, and on 5 August WTI printed its low for the month at 75.22 — which, had the story stopped there, would have looked exactly like the seasonal working.
Then the odds turned. On 11 August a commercial vessel was attacked in the Bab al-Mandeb, killing six, and the US struck a cargo ship attempting to run the blockade of Iran’s ports; Tehran restated that the strait stays closed until it gets reparations and sanctions relief. On the 20th the Treasury announced a fresh round of sanctions and the UAE suspended trade. Prices took the lot straight up.
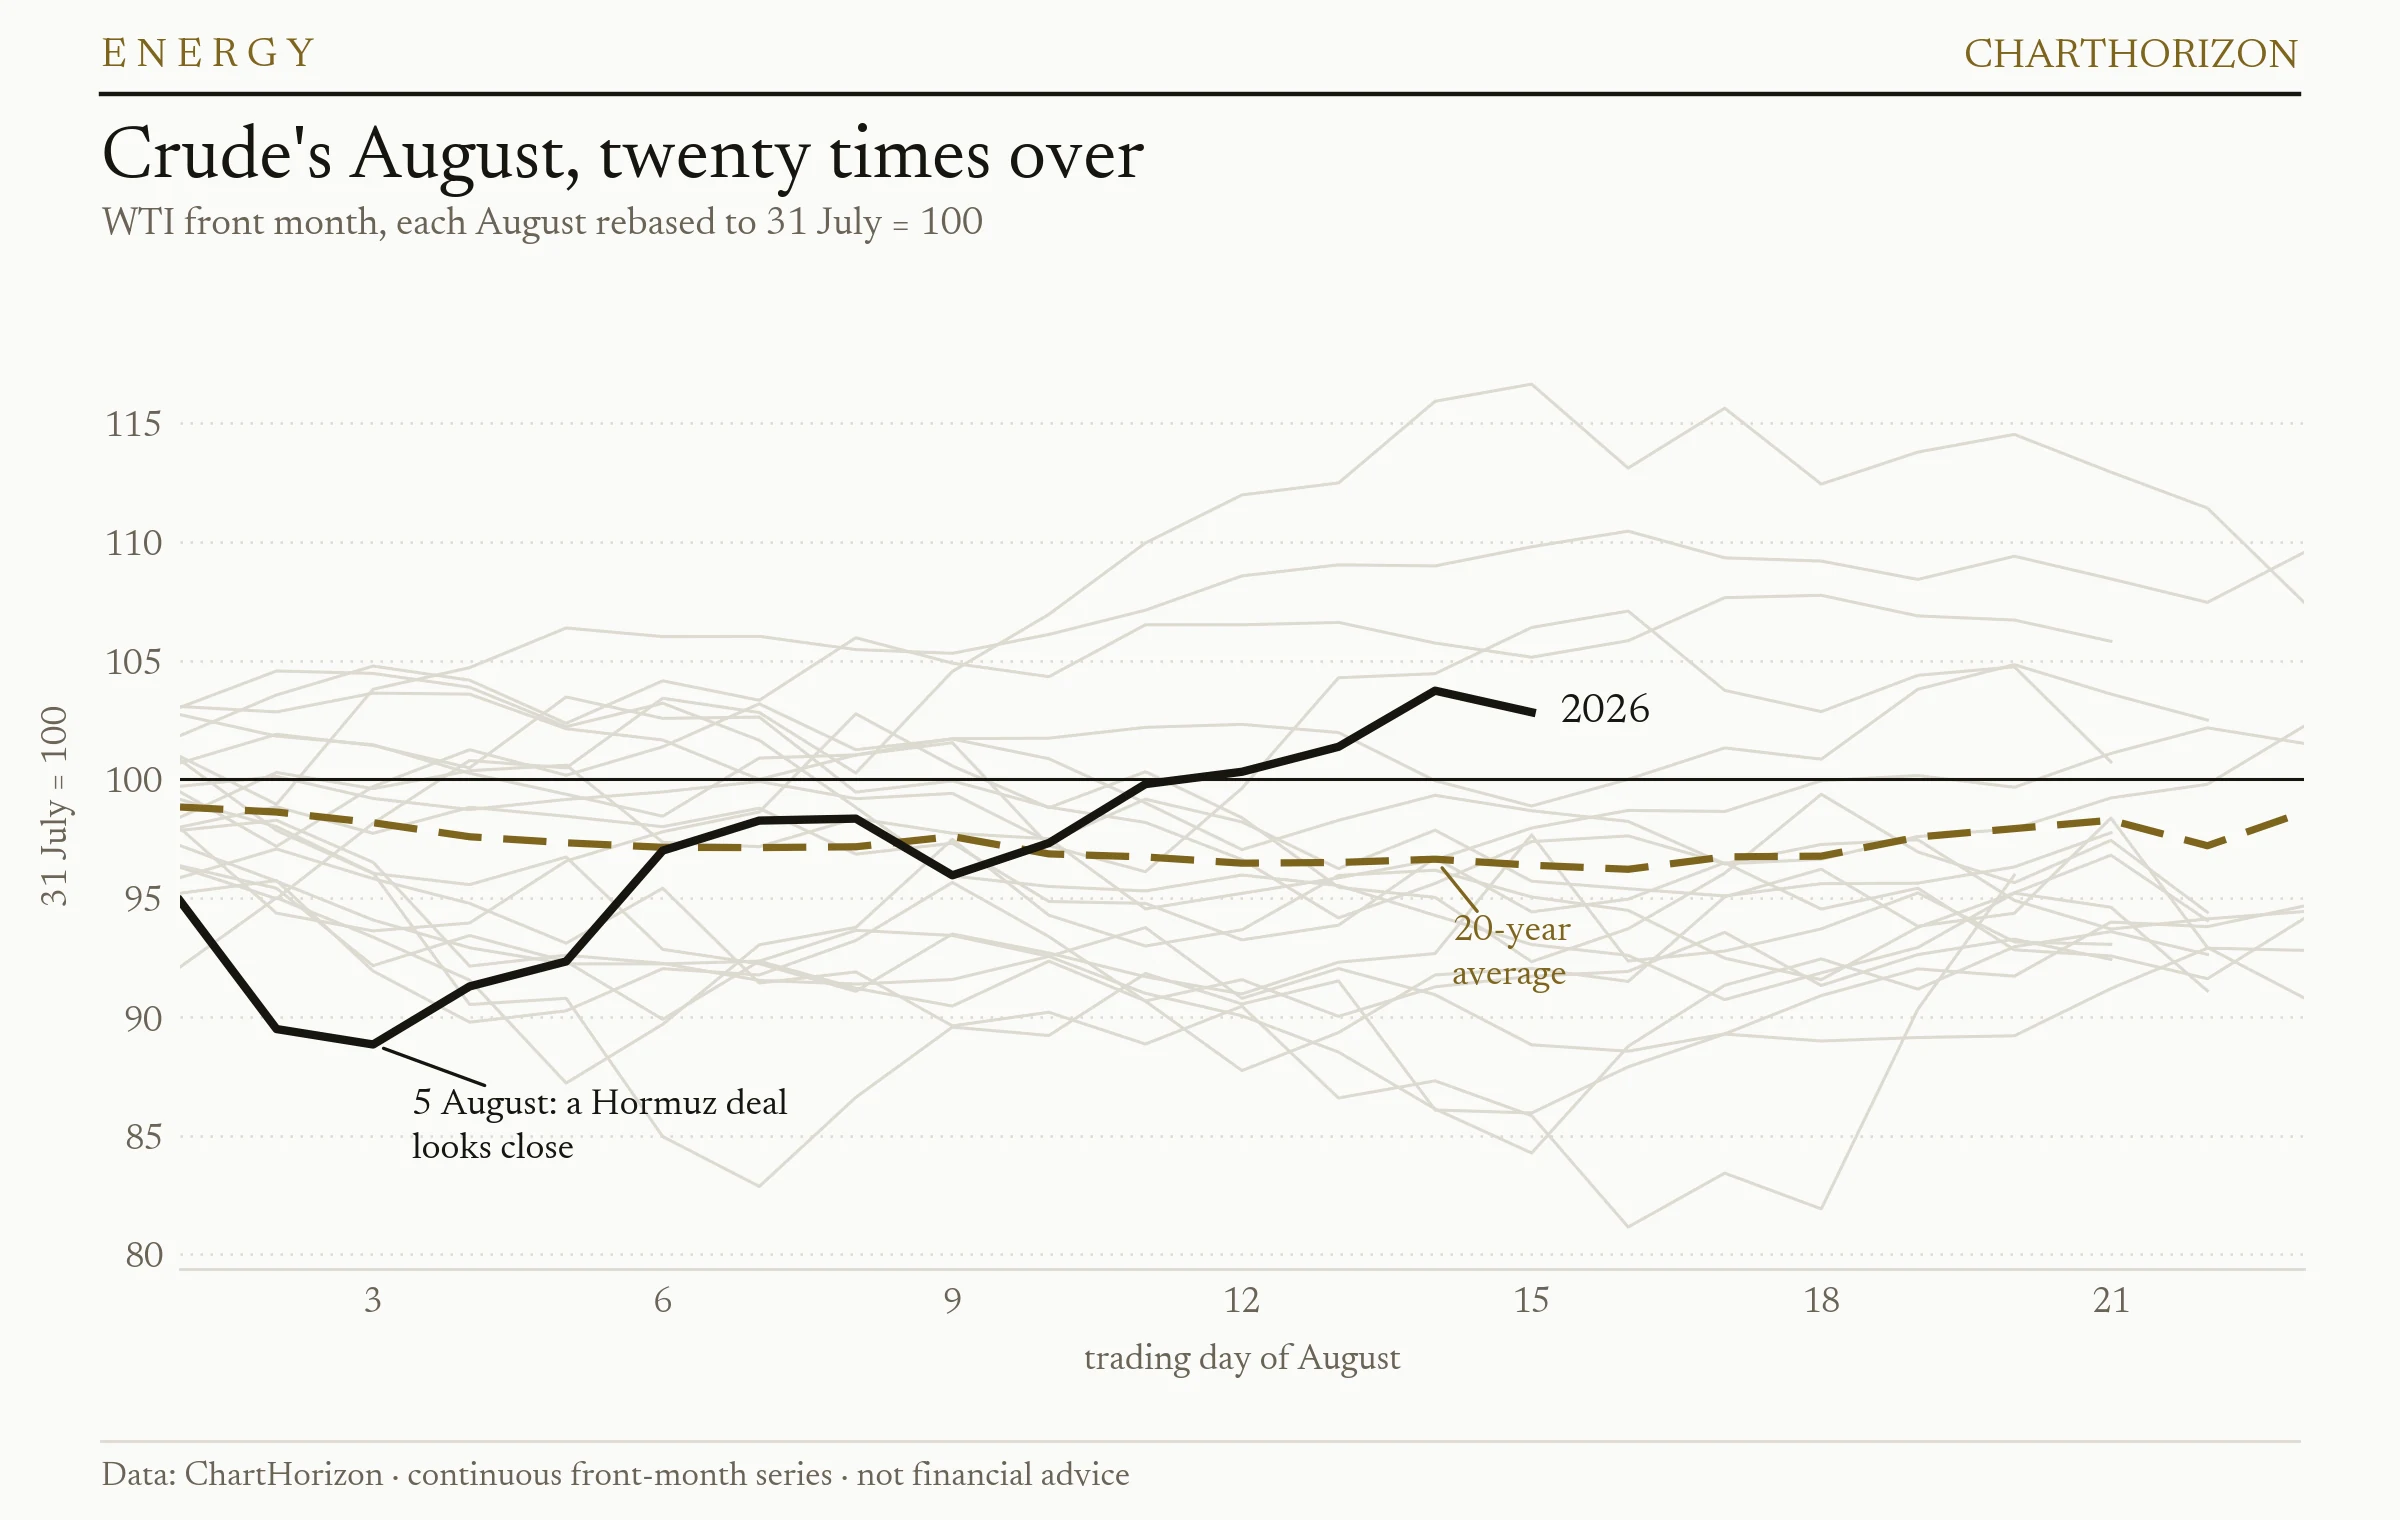
Read the grey lines and the seasonal stops looking like a law. Individual Augusts run from about +17 per cent to −18 per cent; the gold average that sits near 97 is a thin thing assembled out of twenty wildly different months, and no single year has ever much resembled it. What the average says is that if you had shorted crude every August for twenty years you would have come out ahead. What it does not say is anything at all about this August, in which a fifth of the world’s seaborne oil is behind a closed door and the news that matters arrives from Muscat and the Treasury.
That is the honest description of a seasonal: a base rate, computed over conditions that no longer obtain, quietly assuming that nothing more important is going on. It had no vote here.
Testing the maxim
Still — the lore is specific enough to check, so this desk checked it. Every market in the archive with a full run of history, thirty-five of them, split into calendar months, from 2006 to this week. That is 5,026 market-months with a forward window attached.
Three choices in the method do the real work, and they are worth stating because they are where this kind of study usually goes wrong.
The seasonal is defined only on prior years. For any given market, month and year, the expectation is the average of that month’s returns in the years before it, never including the year being graded. This matters more than it sounds. Define the seasonal from all twenty years and then ask which years “failed”, and a failure is by construction a year that dragged the mean it is being measured against — you have built the answer into the question, and the maxim comes out looking true.
The score is signed by the direction the market actually went. For a month that was supposed to rise and fell instead, a further fall counts as positive. So the maxim predicts a larger positive number after failures than after successes. Anything else refutes it.
Significance is bootstrapped over whole years, not observations. Forward windows overlap and markets move together — thirty-five instruments in one October are not thirty-five independent facts. Resampling observations would treat 5,026 correlated numbers as 5,026 independent ones and manufacture confidence out of nothing.
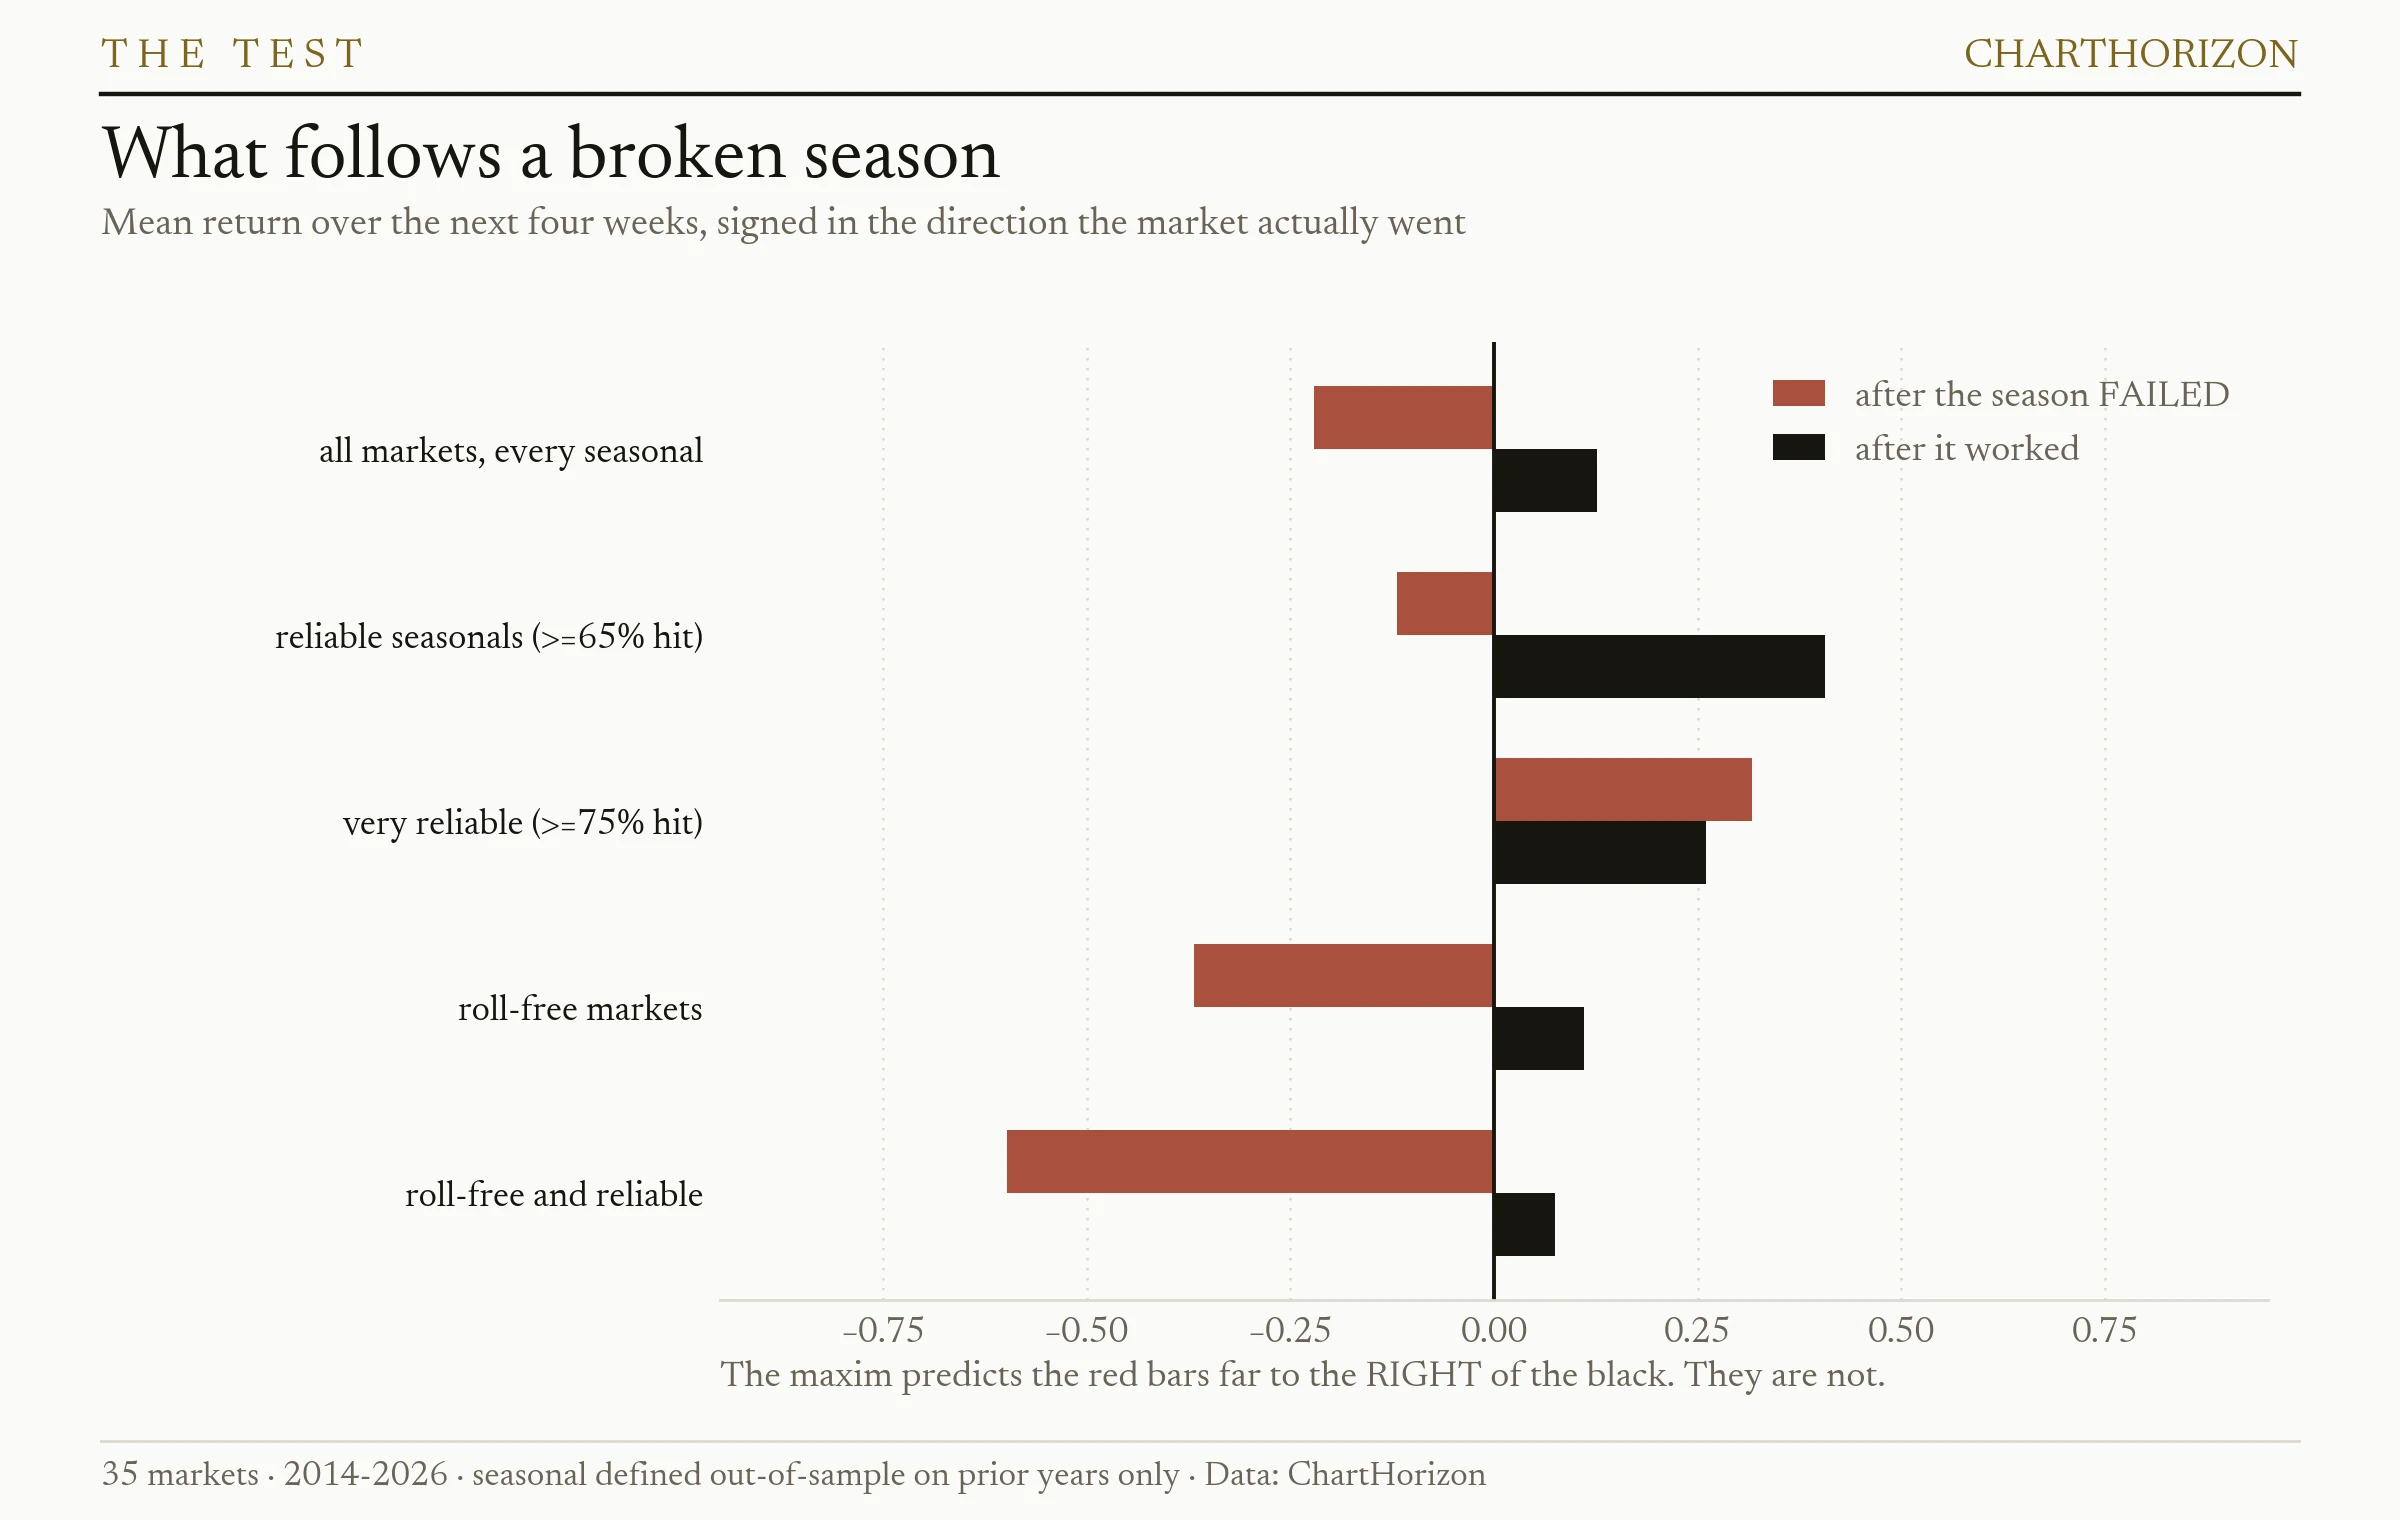
Across everything, the four weeks after a failed seasonal returned −0.22 per cent in the failure’s own direction, against +0.13 per cent after a season that worked. The move continued 47.9 per cent of the time after a failure and 49.3 per cent after a success. At eight weeks the gap widens a little — −0.47 against +0.43 — and the sign never changes.
So the maxim is not merely unsupported. It points the wrong way. A market that breaks its season gives a little back, on average, rather than running.
Why that finding is also worth very little
It would be easy to stop there and sell the inverse as a rule. It does not survive contact with three checks, and the reader is owed all three.
It disappears where the lore is loudest. Nobody invokes the maxim about a coin-flip seasonal; they invoke it about the ones that “always” work. Restrict the sample to seasonals that hit at least 75 per cent of the time in their prior years — the crude-August tier — and the gap between failure and success is +0.06 percentage points, with a bootstrap p of 0.93. That is not a weak result. It is nothing at all, measured precisely where the claim is actually made.
It does not survive controlling for the size of the move. Failures skew toward big months, and big months mean-revert on their own — nothing to do with the calendar. Sorting every market-month into five buckets by the size of the move and comparing within each bucket, the gap runs −0.75 points in the largest bucket, −0.65 and −0.19 and −0.67 in the middle, and +0.52 in the smallest. It flips sign. Whatever is being measured is mostly ordinary mean reversion wearing a seasonal costume.
The market in front of us says nothing either. Crude has broken its bearish August seven times before. Here is what the next four weeks did each time:
| Year | August | Next four weeks |
|---|---|---|
| 2009 | +0.73% | −4.65% |
| 2012 | +9.55% | −4.14% |
| 2013 | +2.49% | −4.94% |
| 2016 | +7.45% | +7.00% |
| 2018 | +1.51% | +7.88% |
| 2020 | +5.81% | −7.79% |
| 2023 | +2.24% | +8.56% |
Three kept going, four gave it back. The median is −4.14 per cent, the mean +0.27 per cent, and the sample is seven. Anyone who tells you what crude does in September because it rose in August is reading a coin.
What is worth taking from a seasonal
A base rate, and only a base rate. It is the answer to “what usually happens here”, which is a reasonable place to start and a terrible place to finish. It carries no information about this year’s cause, and — this is the part the test settles — its failure carries no extra information either. A broken seasonal is not a signal. It is the absence of one.
Which is roughly what you would expect if seasonality is a real but small effect sitting inside a much larger distribution of news. Crude’s August is genuinely soft on average. This August a waterway carrying a fifth of the world’s oil stayed shut. The second fact is bigger than the first by an order of magnitude, and no amount of staring at the first would have told you anything about the second.
What is on the calendar next
With that framing, here are the windows that open in the next several weeks — read as base rates, not forecasts. Twenty years, 2006 to 2025, ranked by how often the direction held.
September
| Market | Direction | Mean | Median | Held |
|---|---|---|---|---|
| RBOB gasoline | down | −7.19% | −8.43% | 80% |
| Corn | up | +2.46% | +4.10% | 75% |
| Lean hogs | up | +3.03% | +3.32% | 70% |
| Wheat | up | +2.87% | +4.61% | 65% |
| Orange juice | down | −2.16% | −2.04% | 65% |
| 30-year T-bond | down | −1.26% | −0.80% | 65% |
| Natural gas | up | +7.12% | +1.42% | 60% |
October
| Market | Direction | Mean | Median | Held |
|---|---|---|---|---|
| Soybean oil | up | +2.58% | +4.14% | 75% |
| Lean hogs | down | −5.88% | −6.15% | 70% |
| Corn | up | +3.52% | +2.02% | 70% |
| Silver | up | +1.49% | +1.80% | 70% |
| 30-year T-bond | down | −1.23% | −0.79% | 70% |
| Yen | down | −0.81% | −0.99% | 70% |
| Natural gas | up | +7.03% | +4.25% | 65% |
Three warnings before anyone acts on a row of that.
The strongest entry on the page is not a trade. RBOB gasoline falls in September four years in five, which looks like the best seasonal in the archive and is largely an accounting artefact. The October contract settles against winter-specification gasoline, which is cheaper to make than the summer grade the September contract settles against. A continuous front-month series rolls from one to the other and books the spec change as a price fall. The gasoline crack does soften in autumn for real reasons too, but a large part of that −7 per cent is the series changing what it is measuring, not the market moving. Every row above marked as a futures market carries some version of this; gasoline is only the loudest.
Read the median beside the mean. Natural gas shows +7.12 per cent for September and a median of +1.42. That gap is hurricanes: a handful of enormous years dragging an average that no typical September resembles. The mean is the number that sells the trade; the median is the number that describes the month.
Sixty-five per cent over twenty years is thirteen years up and seven down. It is a lean, and it is a lean measured on a sample small enough that a couple of different Septembers would move it several points. The one row above that carries no roll asterisk at all is the yen — spot FX, no contract to change — which is worth noting mostly because it is the exception.
The useful posture for the weeks ahead is the one crude has just demonstrated. Know the base rate. Then go and find out what is actually happening, because that is what will set the price — and when the two disagree, it is not the news that is wrong.
Informational and educational only — not financial advice. Futures trading involves substantial risk of loss; seasonal and positioning signals do not guarantee future results. Signals and charts: ChartHorizon (local end-of-day data).