Paid to Wait
Tuesday the grain producers sat near the short end of their three-year range. Wednesday the USDA cut the corn yield. By Friday wheat had added 3.3 per cent.
COT through the 11 August report · prices through 14 August 2026 · a positioning note · Data: ChartHorizon, CFTC & USDA
On Tuesday, 11 August, the producers and merchants who grow and handle American grain were carrying forward sales near the heaviest end of their three-year range. On Wednesday the Department of Agriculture cut its corn yield estimate. On Friday Russia dismissed a proposal to stop shooting at ships in the Black Sea, and wheat closed up three and a quarter per cent.
That is the week in the order it happened, and the order is the whole point. The Commitments of Traders report published on Friday carries a snapshot dated Tuesday — before the yield estimate, before the rejection, before the rally. What it shows is a farm sector that had already decided what this crop was worth.
What the producers filed
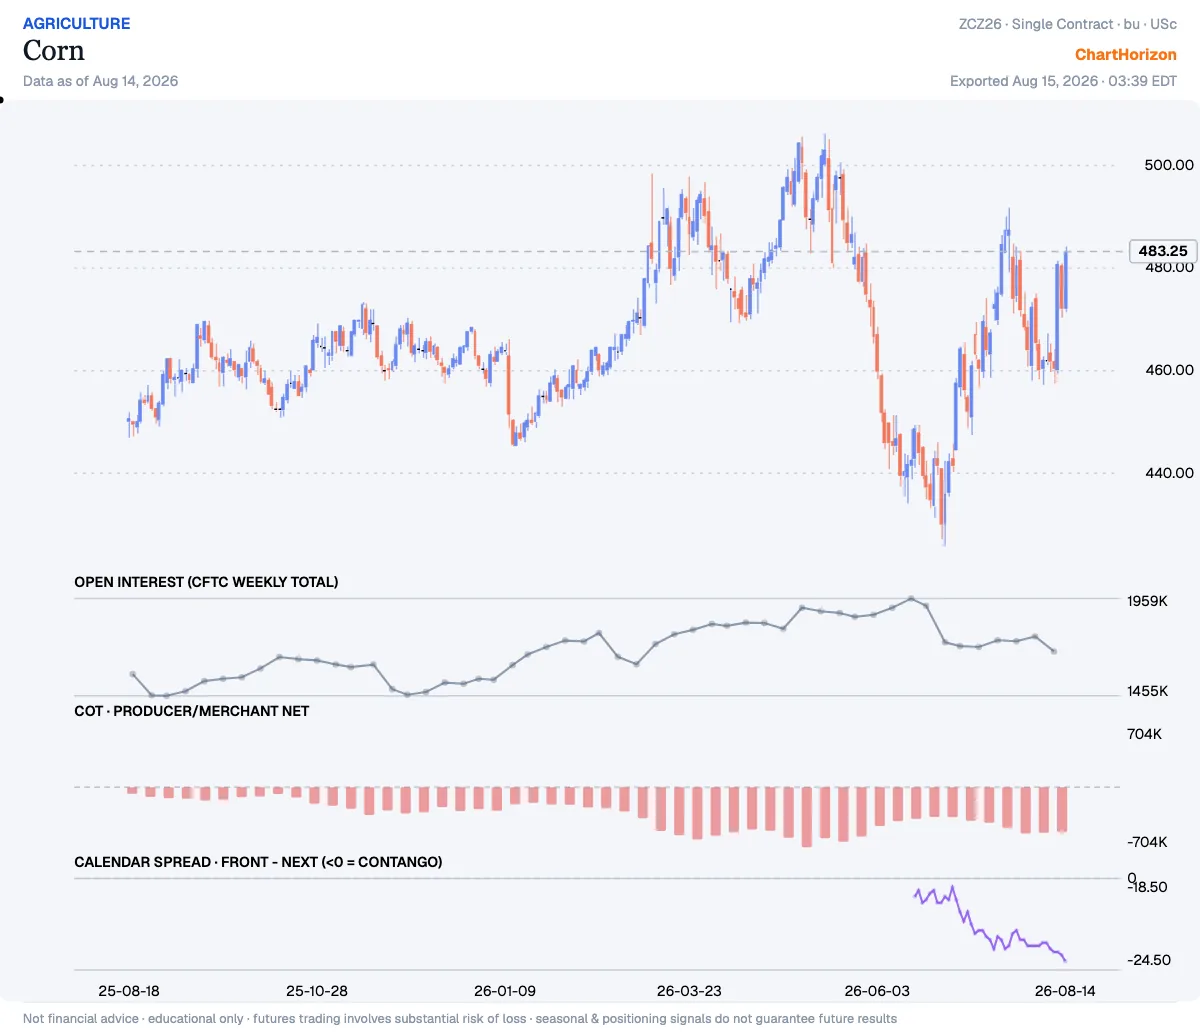
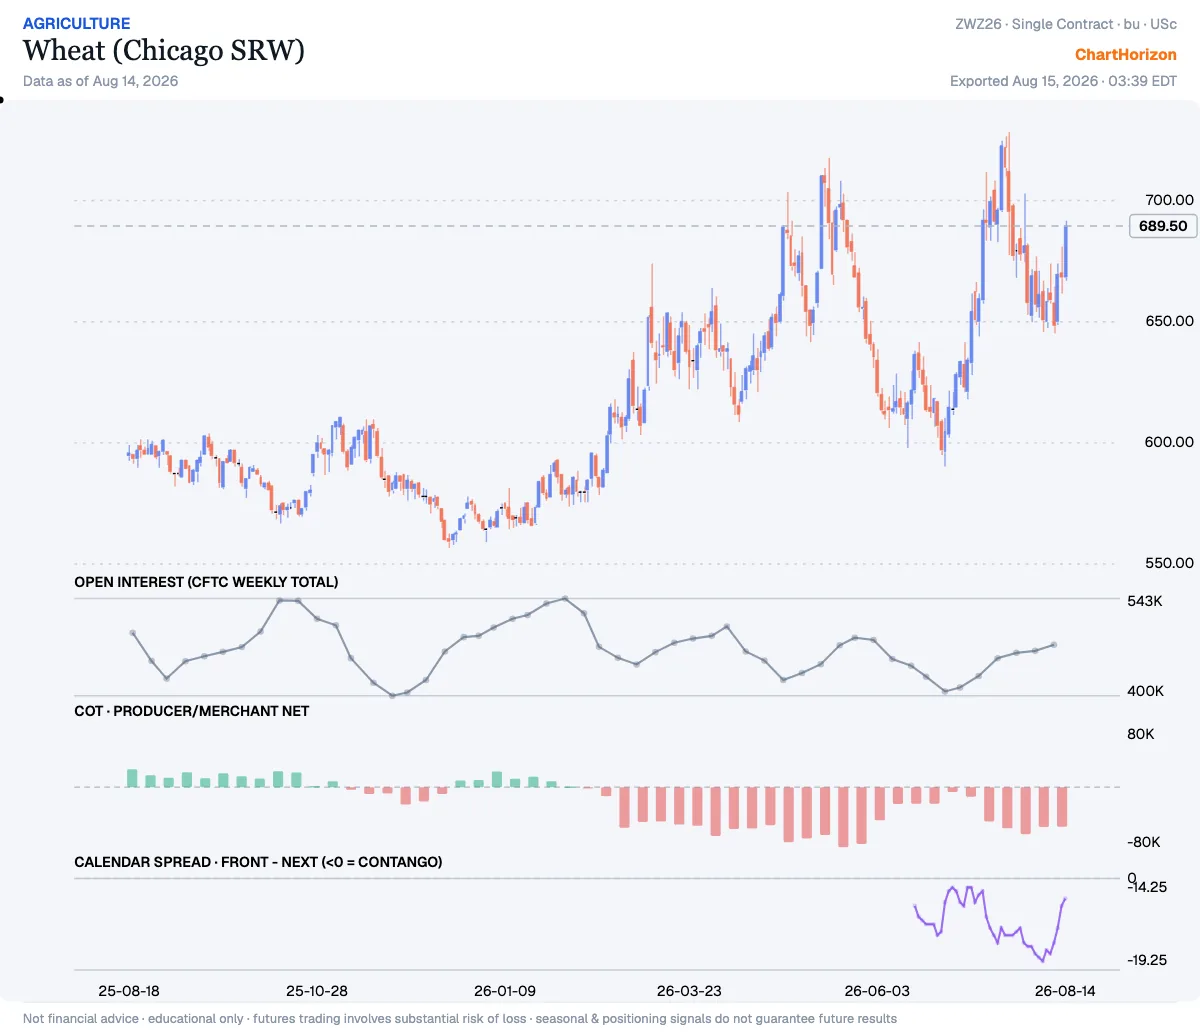
In corn the producer/merchant book is net short 525,668 contracts — the 13th percentile of its three-year range, which runs from a net short of 713,311 to a net long of 48,600. In Chicago wheat the same cohort is net short 52,632, the 10th percentile. Soybeans sit at the 19th.
None of this is a forecast, and it is worth being precise about why. A grower with a crop in the field is short the market as a matter of arithmetic. He owns the physical bushel; selling it forward is how he stops owning the price. Heavy producer hedging is not a bearish opinion. It is a statement that the price on offer was good enough to stop arguing about.
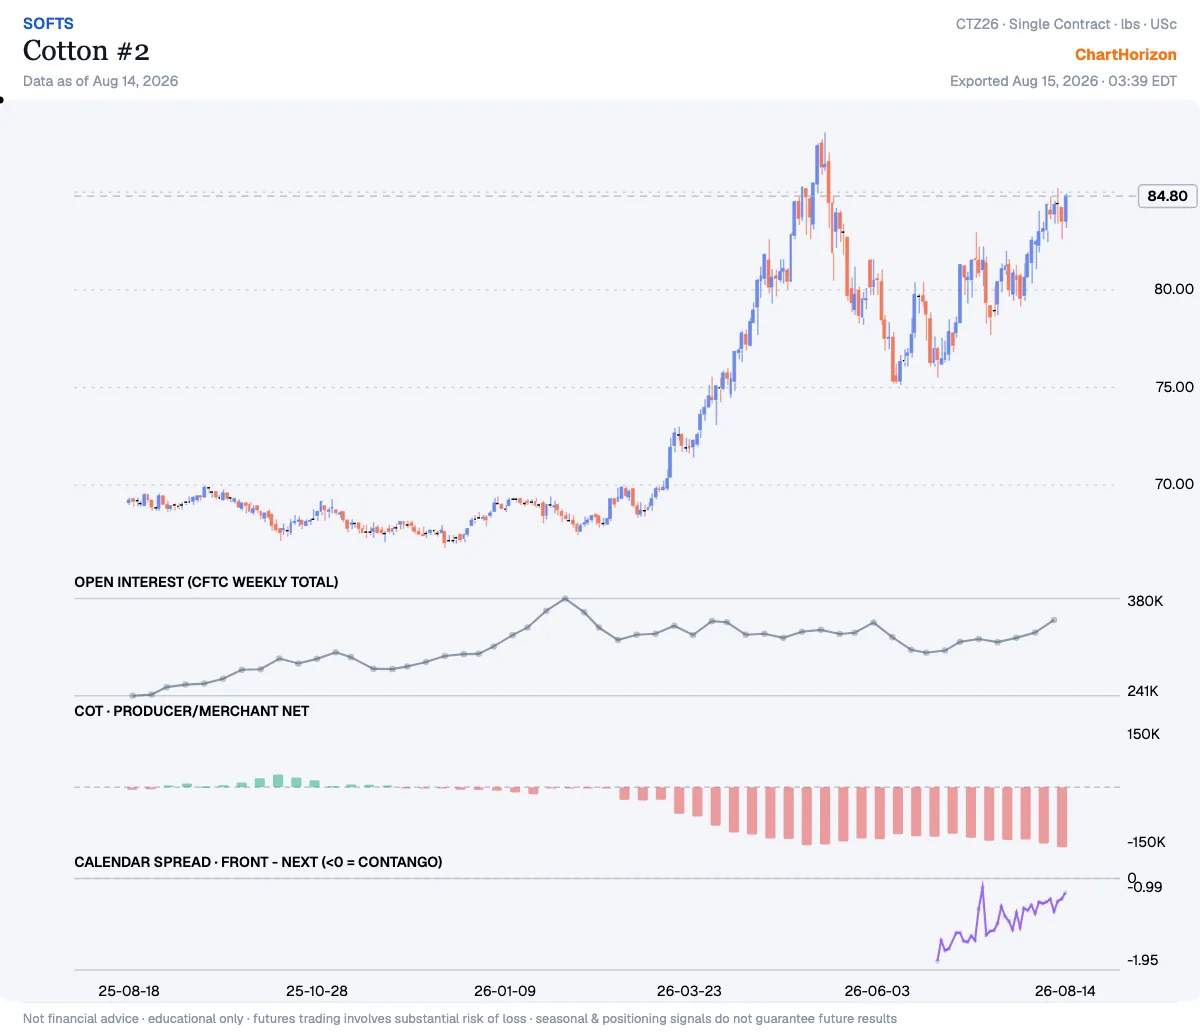
Cotton is the entry that has gone furthest. The producer book there is net short 149,999 contracts — the lowest reading in three years, a fresh record for that window, and deeper than the 140,793 that appeared in this column a week ago. Growers are hedged into their own crop harder than at any point since 2023, and the fibre still added better than one and a half per cent on the week.
What arrived afterwards
Wednesday’s WASDE was the report the whole complex had been waiting on, and it was not the one-way bullish document the price reaction suggests.
The Department cut its 2026 corn yield to 180.7 bushels per acre, from 183 previously and against an analyst consensus nearer 182.4. That is the headline, and it is genuinely lower. But the same report put the crop at 16.0 billion bushels — the second largest on record, and thirteen million bushels higher than the July figure, because the acreage came up even as the yield came down. Combined corn and soybean plantings were raised nearly 2.8 million acres against the June estimate. Ending stocks fell 137 million bushels, to 1.7 billion. Soybean yield came off to 52.7 bushels from 53, yet soybean ending stocks rose ten million bushels to 320 million. New-crop wheat carryout slipped to 717 million bushels from 722 million.
Read that as a whole and it says: a slightly smaller crop than we thought, on top of a very large one, meeting demand that is finally rising to meet it.
Wheat had a different and more serious story. Sixty-three per cent of American spring wheat acreage sat in moderate-or-worse drought in the first week of August, and good-to-excellent condition ratings fell four points in a week, to 51 per cent. Then the geopolitics. Ukraine had offered to halt attacks on shipping in the Black Sea; on Friday Russia dismissed the idea and ruled out any return to the grain corridor of 2022–23. Ukrainian grain exports are running 76 per cent below last year so far this month, and Kyiv’s own agriculture ministry now projects agricultural exports falling from 64.4 million tonnes to 29.6 — with corn shipments down 39 per cent and wheat down 26.
September Chicago wheat settled Friday at 674.0, up 21¼ cents. September corn settled at 459¼, up 11¼. Both moved against a positioning read that had been leaning the other way all week.
The curve that did not agree
Here is where the tape says something the headline does not, and it is the reason this note exists.
Both grains rallied. Only one of the two curves believed it.
Wheat’s front-to-next calendar spread began the week at 18½ cents of contango and ended it at 15 — the front month bidding up against the deferred, three and a half cents of carry taken out over the week. That is what a supply scare looks like from the inside. When the nearby contract starts outrunning the one behind it, the market is saying the shortage is now, not next spring.
Corn did the opposite. Its spread went from 23 cents of contango to 24½ — wider, not tighter, straight through the yield cut. The corn market took the smaller yield, looked at 16 billion bushels and 1.7 billion of carryout, and asked to be paid more to store it. The full curve says the same thing without ambiguity: September 459¼, December 483¾, March 499, May 506¾, and July 2027 at 509½. Fifty cents of carry to hold a bushel for ten months is not the shape of a market that is short of grain. It is the shape of a market being paid to wait.
That distinction is the useful output of the week. The wheat rally has a curve underneath it. The corn rally, so far, has a headline.
Where the signal argues with itself
An honest ledger includes the entries that spoil the story, and there are three.
The first is that ChartHorizon’s own read was leaning the wrong way into Friday. Both corn and wheat carried a bearish positioning signal, a bearish hedging signal and a discount term structure against a neutral seasonal — one bullish factor against two bearish ones, and the market added between two and a half and three and a quarter per cent anyway. A method that only gets quoted when it works is not a method.
The second is sugar. Its producer book sits at the 7th percentile, hedged nearly as hard as corn and harder than soybeans, and sugar fell 1.3 per cent on the day the grains ran. If heavy producer hedging were a reliable contrarian trigger, it would have fired there too. It did not. Positioning tells you what the participants have committed to. It does not tell you when.
The third is the calendar. Both grains are days away from the seasonal windows the dashboard tracks — wheat’s bullish onset falls on 26 August, corn’s on 10 September. A rally that arrives just before a seasonally supportive stretch is harder to dismiss as noise than one that arrives against it, and neither of those windows had opened when the producers filed on Tuesday.
Three things would settle this, and none of them requires a forecast.
If the wheat story is real, its carry keeps narrowing and eventually flips — the front bid through the deferred, the market paying for delivery now rather than storage later. If the corn rally was a headline, the spread stays wide and the December contract drifts back toward the crop that the acreage actually produced. And if the producers were early rather than wrong, the next few reports show them holding those hedges into strength instead of buying them back.
That last one is the entry worth watching, because it is the only one where the people with the physical crop get a vote. They sold forward on Tuesday, into a market that was about to be told its harvest was smaller. Everything since has been the tape asking whether they were careless or merely unhurried — and the curve, for now, is still offering to pay them for the wait.
Informational and educational only — not financial advice. Futures trading involves substantial risk of loss; seasonal and positioning signals do not guarantee future results. Signals and charts: ChartHorizon (local end-of-day data).