Fifty Funds
The yen is the funding leg, not the trigger. Hedge funds hold $4tn of gross Treasury exposure, ninety per cent of it in fifty funds, financed by $3tn of repo.
Prices through 24 August 2026 · COT through the 18 August report · a structure note · Data: ChartHorizon, CFTC, Federal Reserve, OFR & press reports · Charts: ChartHorizon
The dollar bought 163.59 yen on 28 July, a level it had not seen since 1986. Two sessions later it bought 158.70. Japan’s Ministry of Finance is reported to have sold something close to sixty billion dollars that Thursday, another twenty-five billion on the Friday, and on 3 August Tokyo and Washington confirmed what the market had already priced: the US Treasury had joined in. It was the first coordinated intervention between the two since 2011 — and that one was aimed at pushing the yen down, not holding it up.
It worked, in the narrow sense. The dollar printed 156.54 on 3 August, seven yen below where it had started the week.
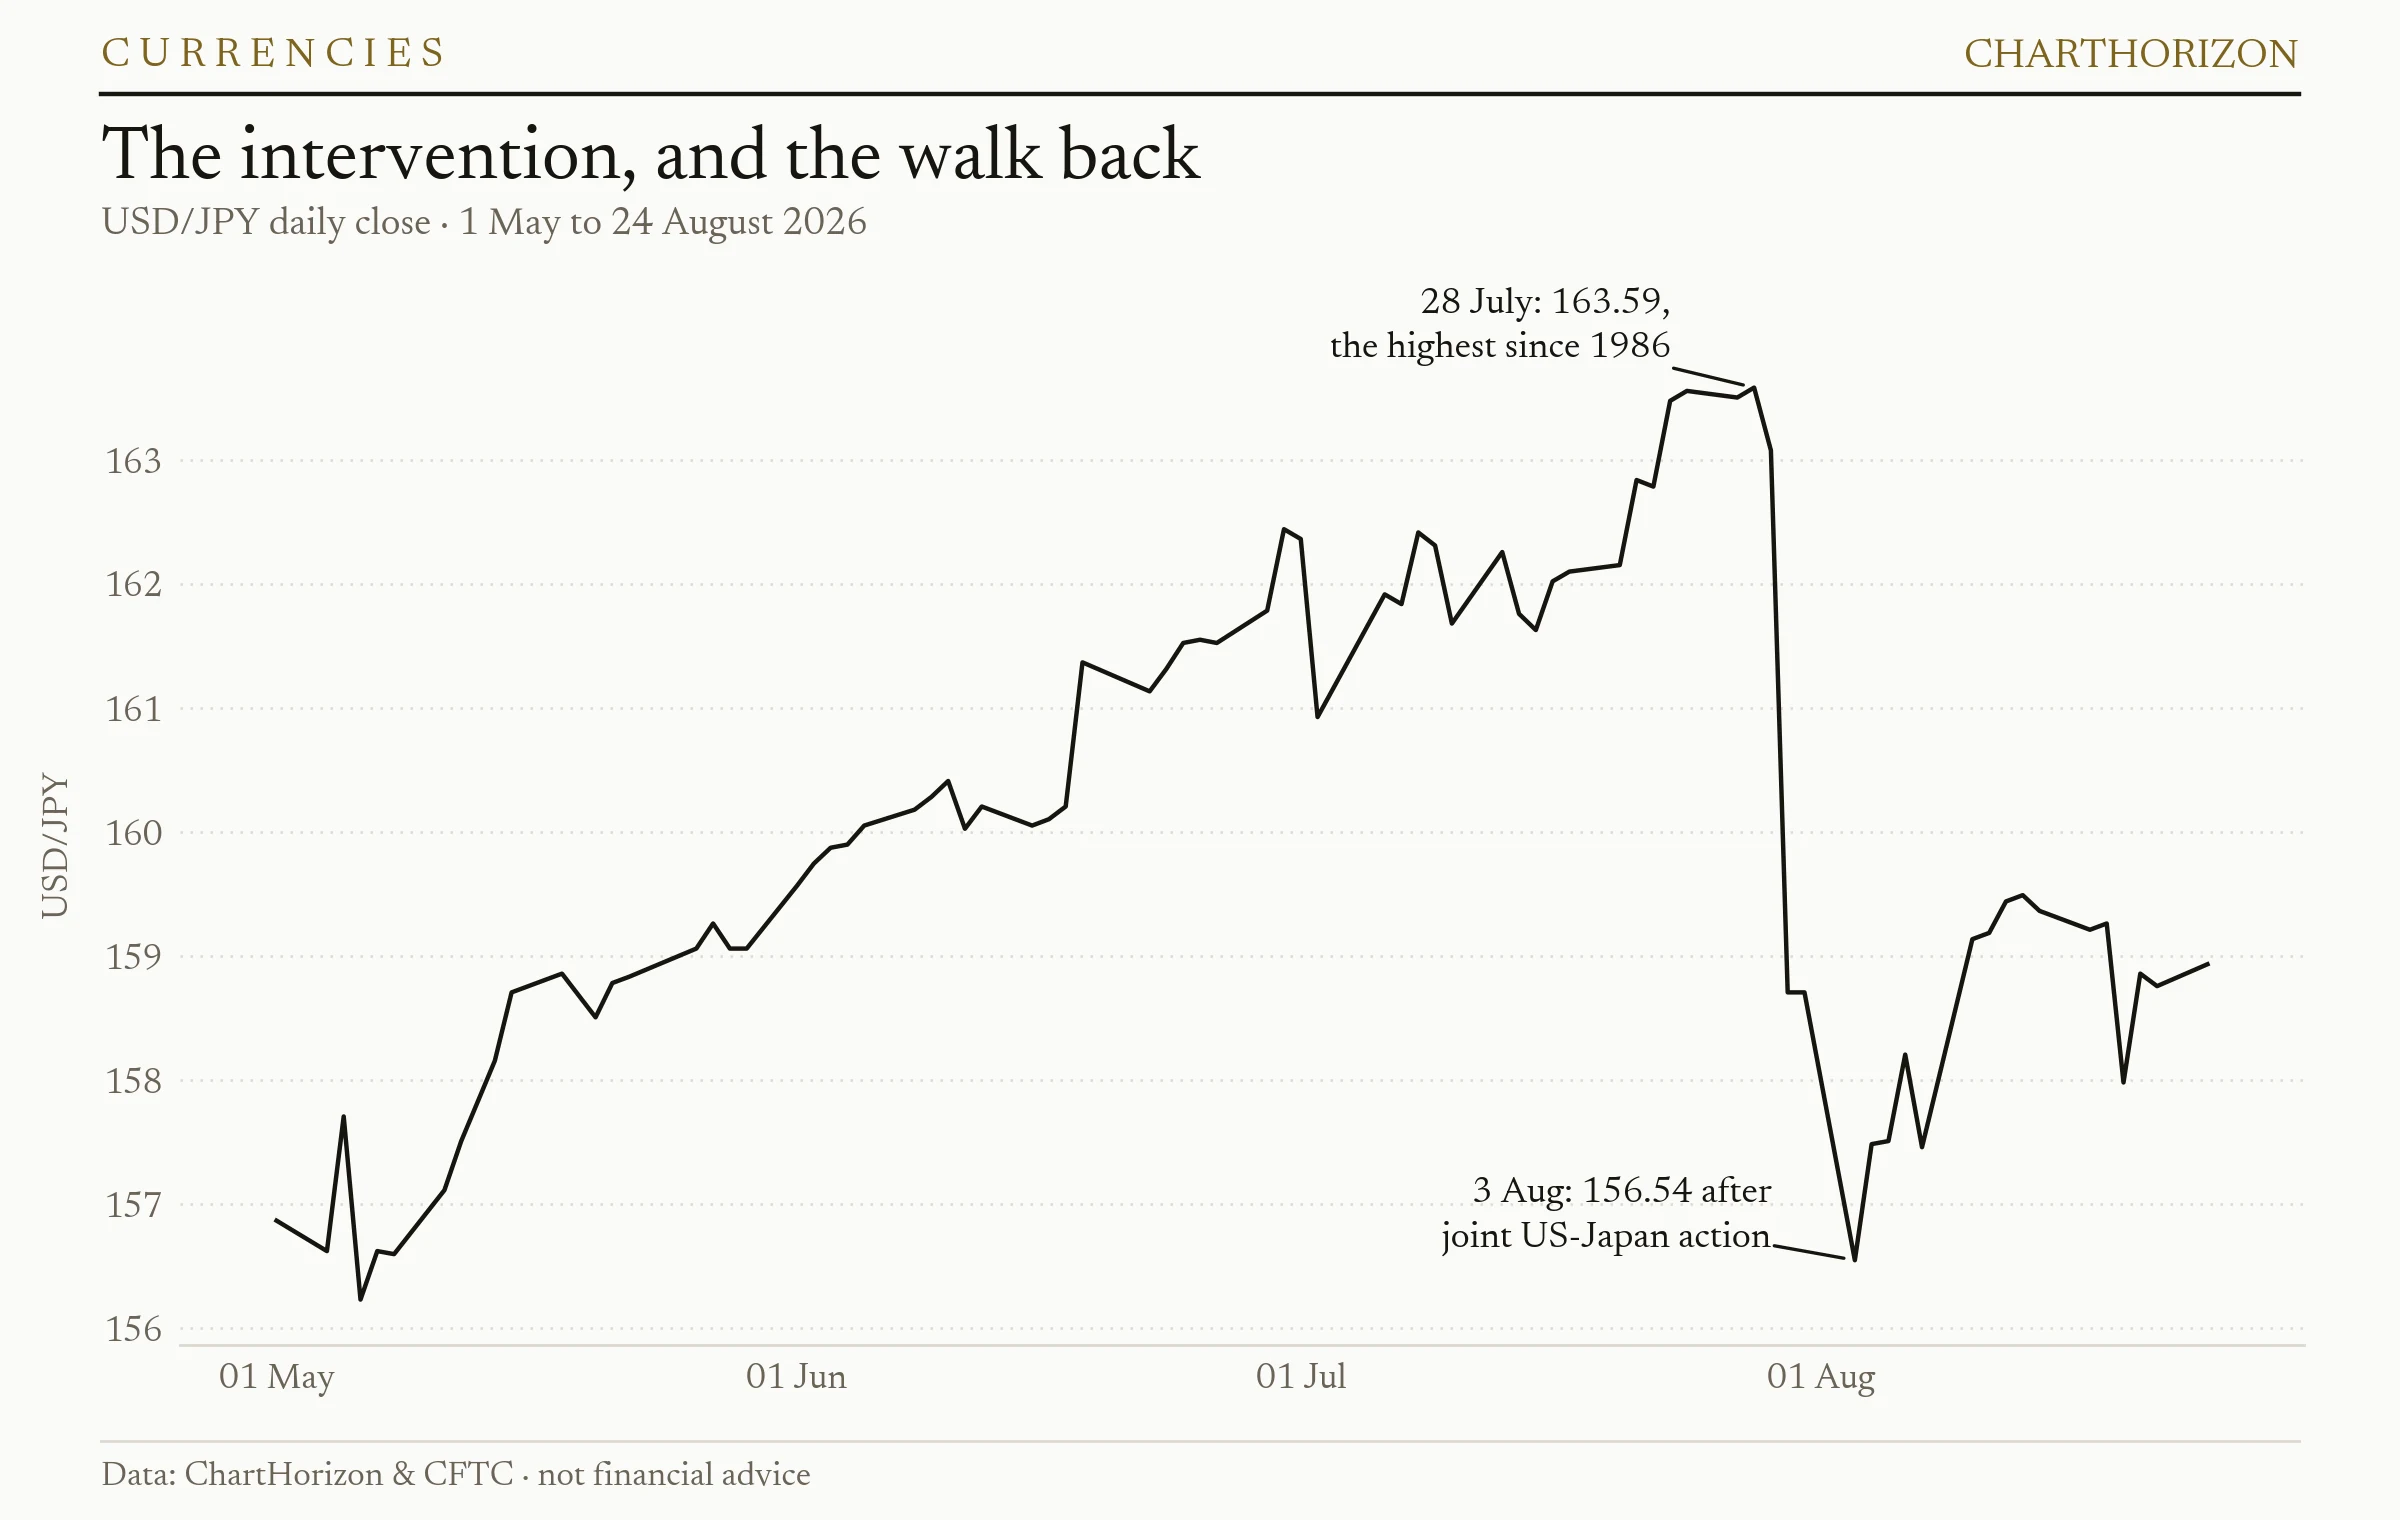
Three weeks later the dollar is back at 158.93. More than half the intervention has been given back, and it was given back for a reason that ought to worry anyone reading it as a warning shot: over the two weeks to 15 August, Japanese investors bought more than five trillion yen of foreign equities and long-term bonds. The MoF did not close the trade. It handed the people putting it on a better entry, and they took it. The policy rate is 1.0 per cent after June’s hike, the gap between Japanese and US ten-year yields is still around 1.8 percentage points, and the market prices roughly an eighty per cent chance of another twenty-five basis points in September. None of that is enough to make funding in yen a bad idea.
So the useful question is not when the carry trade unwinds. It is what the unwind would land on — because the yen is the funding leg. Whatever is fragile is on the other side of it, and it is not in Tokyo.
The asset leg
The largest concentration of leveraged exposure to a funding shock anywhere in the world sits in the US Treasury market, and it has roughly doubled in three years.
The Federal Reserve published a decomposition of it on 22 June. On September 2025 data, hedge funds carried four trillion dollars of gross Treasury exposure — 2.4 trillion long against 1.6 trillion short — which is about 8.5 per cent of all privately held Treasuries by market value, against roughly 4.5 per cent in early 2023. Inside that number the cash-futures basis trade was 830 billion, close to double its early-2020 peak. Swap-spread arbitrage was another 305 billion. Financing it was three trillion dollars of repo borrowing, more than double the level of early 2023.
The Office of Financial Research added the cash side of the picture six days ago. Hedge funds’ outright Treasury holdings reached two trillion dollars at the end of 2025 — nearly triple the figure of five years earlier, and a record seven per cent of the $28.9tn marketable market. Their short futures position stood at 1.4 trillion, against roughly 1.7 trillion of asset-manager longs on the other side.
Those are large numbers, and largeness by itself is not fragility. This is the number that is:
Ninety per cent of that four trillion sits in the fifty largest funds. In early 2023 it was eighty-four per cent.
That is the answer to the question of who stands at the end of the collateral chain. Not a Japanese life insurer, and not a retail account in Osaka. Fifty funds, financed overnight, against the one piece of collateral every other price in the system is quoted off.
The other side of it, in this desk’s own data
The CFTC report of 18 August puts the commercial net position in the 10-year T-Note at 914,385 contracts long — the 97th percentile of its three-year range. The 30-Year Bond sits at 164,664, the 98th. Both were on last Friday’s ledger, and the 10-year’s record for this archive, 995,416 contracts, was set on 4 August: three weeks ago.
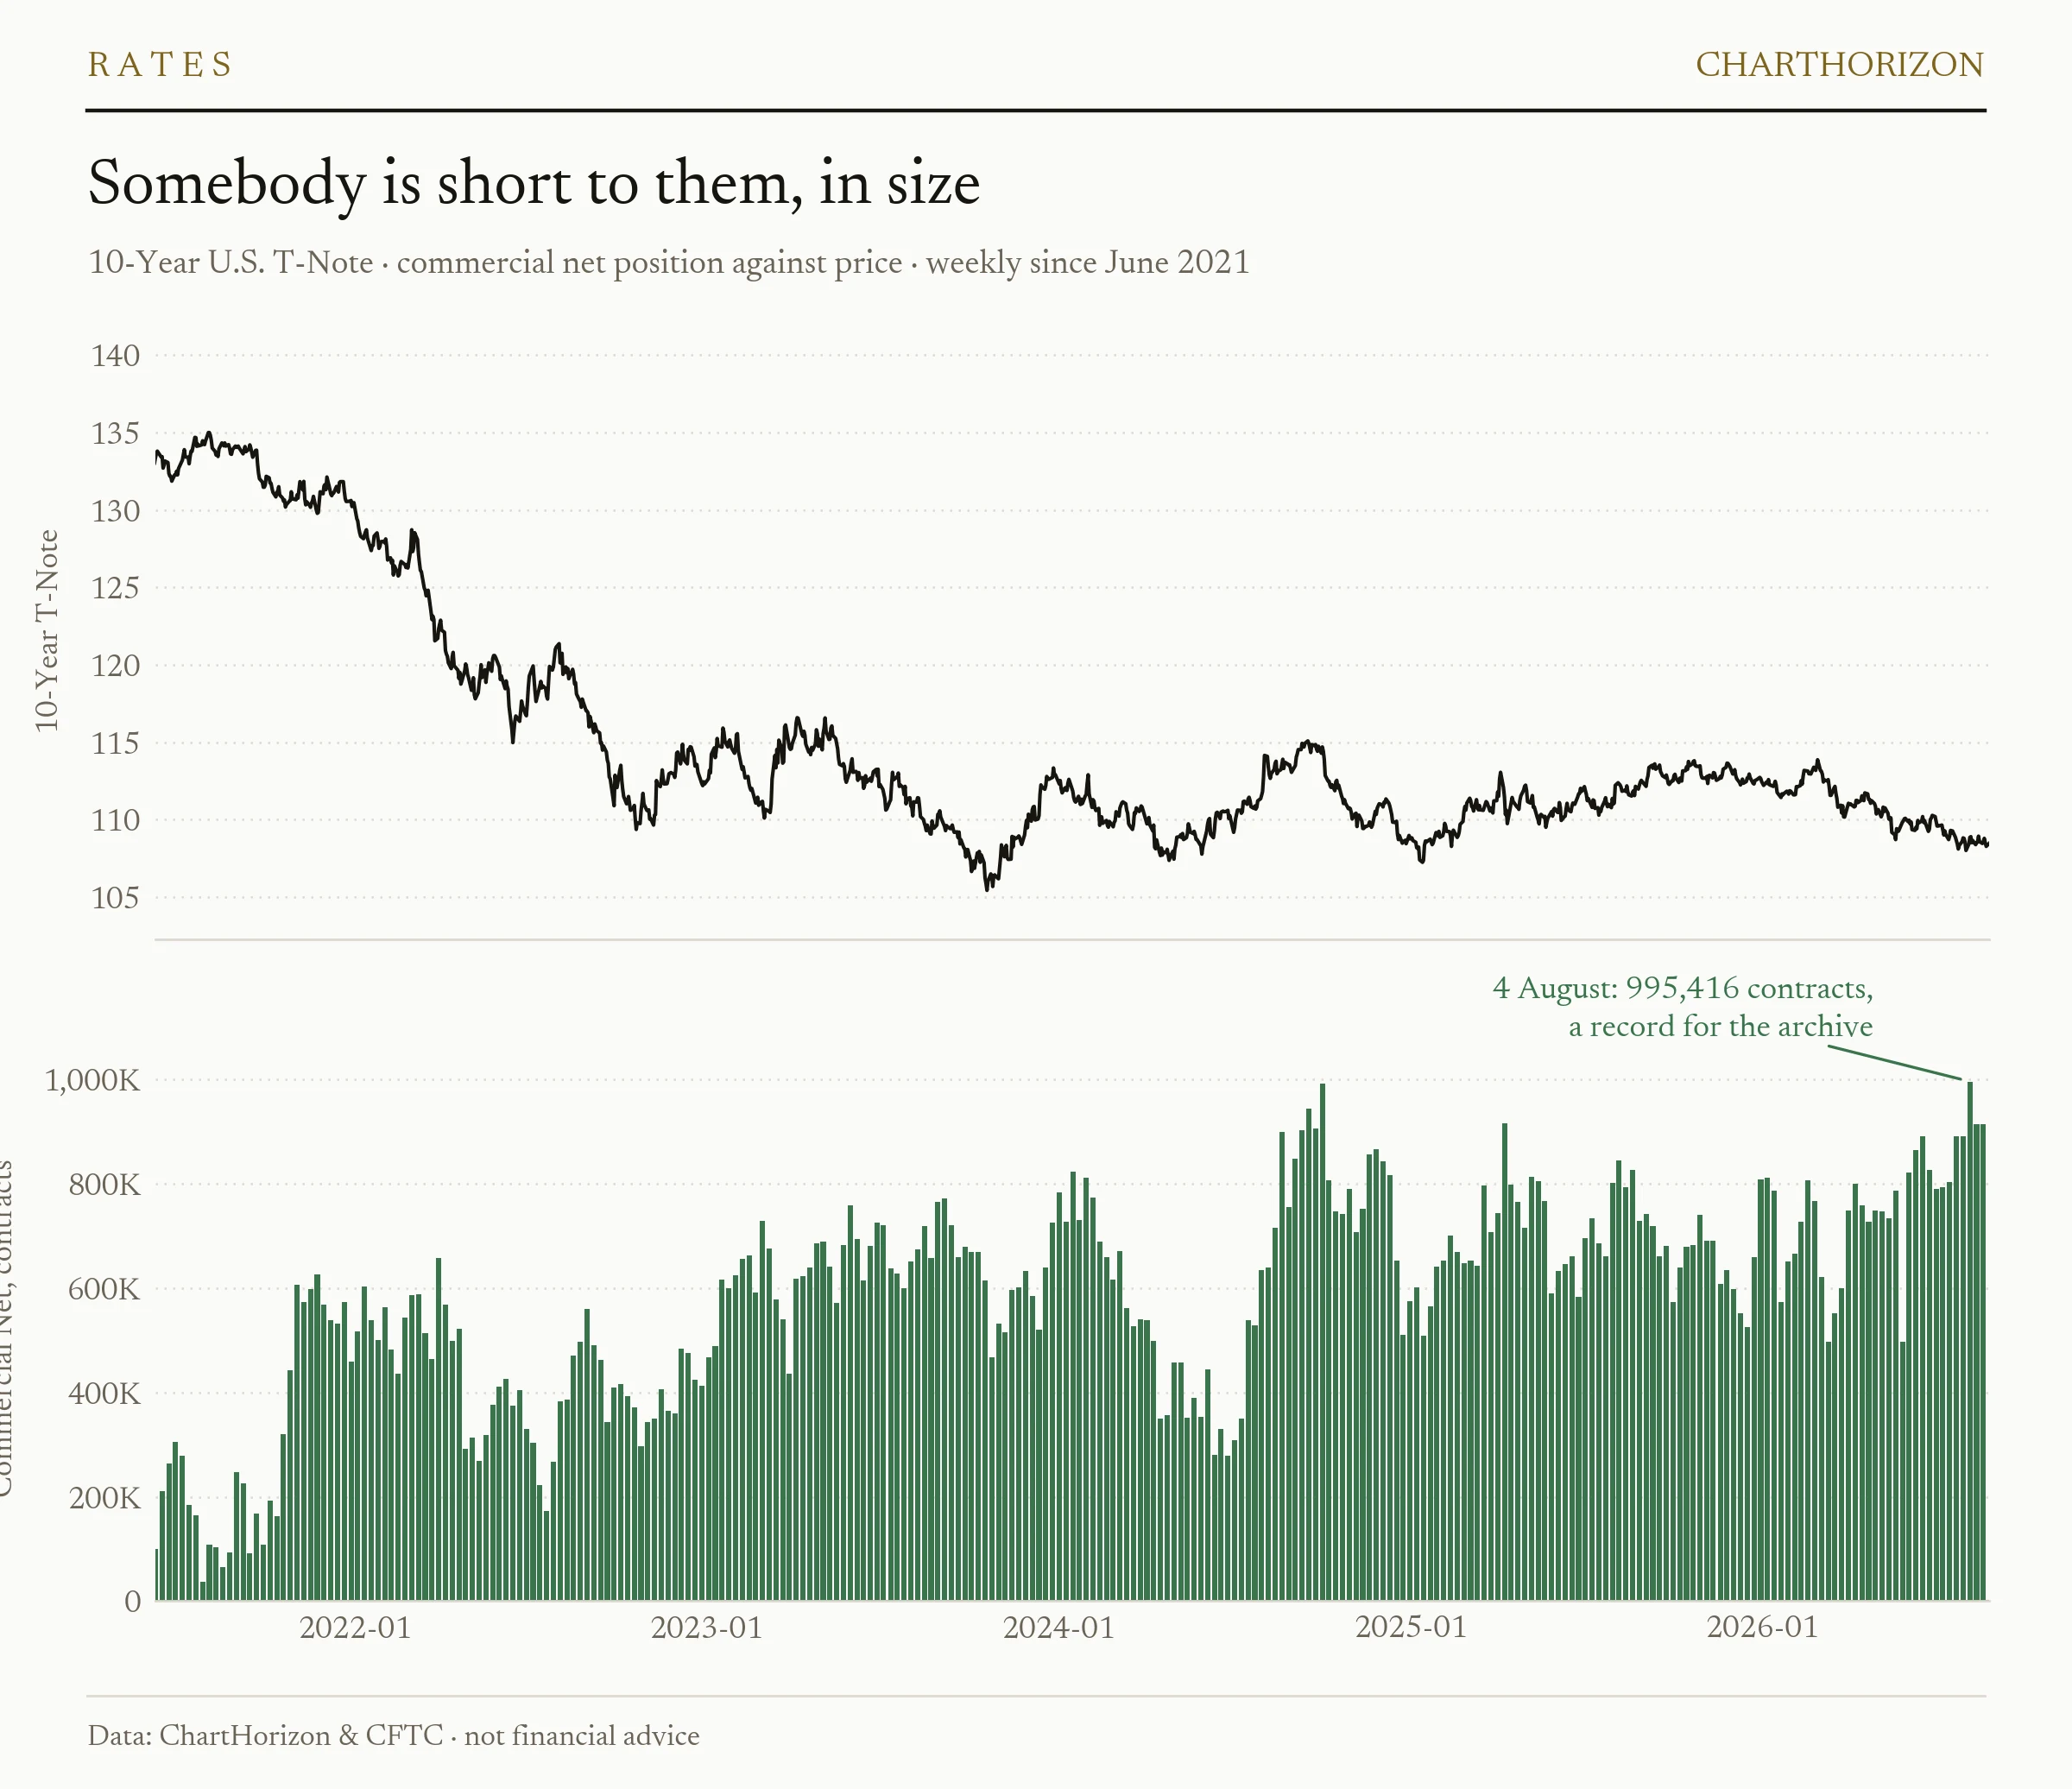
Through 2021 that book averaged 298,240 contracts. It has roughly tripled. A caveat belongs here and this desk will not skip it: the archive carries the commercial side only. It cannot name who is short to them, and nothing in this table should be read as a spec-versus-commercial divergence. What it can say is that the intermediary book has grown to three times its size at a period when open interest in the contract went from 5.27 million on 4 August to 5.60 million on the 18th. Positions arriving, not rearranging.
What sharpens it is where along the curve this sits.
| Contract | Commercial net, 18 Aug | Percentile, 3-year |
|---|---|---|
| 30-Year U.S. T-Bond | +164,664 | 98th |
| 10-Year U.S. T-Note | +914,385 | 97th |
| 5-Year U.S. T-Note | +1,245,587 | 24th |
| 2-Year U.S. T-Note | +888,316 | 13th |
A book that had simply taken a view on duration would not look like that. The long end is at a three-year high and the front end is at a three-year low, in the same week, in the same complex. That is not a view. That is a structure — positioning concentrated in specific tenors, which is exactly where the Fed’s own decomposition puts the basis and swap-spread books. Two independent sources, one from Washington and one from this desk’s archive, describing the same thing from opposite sides of the trade.
What April 2025 proved, and what it did not
The standard reassurance is that this was all tested sixteen months ago and held. That is true, and the detail underneath it is the most important thing in this note, because almost everyone gets which trade broke wrong.
According to the New York Fed’s manager of the System Open Market Account, what unwound in April 2025 was the swap-spread trade, not the basis trade. About sixty billion dollars — a fifth of the book — came off in April, and a further forty billion in May, from a peak near 295 billion in March. The basis positions, meanwhile, were stable. Treasury volatility rose sharply and the cash-futures bases were largely unaffected.
The reason given for that stability is the whole point: repo funding remained available and dealer intermediation capacity held.
So the levered Treasury complex has now been tested against a volatility shock, and it passed. It has never been tested against a funding shock.
Which is precisely what a carry unwind is
The popular model of a yen unwind runs yen to assets: the funding currency rallies, the trades it paid for get sold, everything falls together. That is what August 2024 looked like from the outside, and it is why the Nikkei fell twelve per cent in a day while the currency moved five.
The mechanical version runs somewhere else entirely. A yen unwind is, first, a dollar funding event. The Bank for International Settlements has spent years pointing at the size of it: more than eighty trillion dollars of dollar payment obligations sit in FX swaps and forwards, recorded off balance sheet because they are derivatives rather than debt. Non-US banks owe upwards of thirty-five trillion of it; non-US non-banks as much as twenty-six trillion, roughly double their thirteen trillion of on-balance-sheet dollar debt. Most of it is short-dated. That makes it rollover risk, not margin risk — nobody gets a margin call, they simply have to find the dollars again in three months, and the price of finding them is the cross-currency basis.
The chain from there is short. The basis widens; offshore dollar funding gets dearer; the flow lands on the same dozen dealer balance sheets that intermediate repo; those balance sheets have less room; haircuts and margin requirements rise across everything financed on them. The trades that then have to shrink are not the ones connected to Japan. They are the ones that happen to share the plumbing.
The Fed’s own review of repo vulnerabilities, published this month by Banegas, Devigne, Mamburu, Nikolaou, Samarina and Tamburrini, states the mechanism without embellishment: short-term funding, dealer intermediation, extensive collateral reuse and low haircuts are what make the market efficient, and they are the same channels through which stress travels. There is no version of this market that has one without the other.
Who is actually at the end
Strip the intermediaries out and the hierarchy is simple. The terminal collateral is the US Treasury security itself — there is no rung above it, and everything below is valued against it and transformed into it. The terminal balance sheet is the Federal Reserve, reachable through the standing repo facility, the FIMA facility for foreign central banks, and the swap lines.
Between those two ends: about a dozen dealers, money market funds as the marginal cash lender, and fifty hedge funds holding ninety per cent of the levered position. The intermediation is private and the backstop is public, and the private part is narrower every year.
What has changed since the last test — in both directions
In the system’s favour, and it is not trivial. Quantitative tightening is finished; the balance sheet stood at $6.75tn on the H.4.1 of 20 August. Reserves are $2.94tn. The overnight reverse repo facility is back to $373.7bn, which is a genuine buffer again after being drained to almost nothing. SOFR was running level with interest on reserves at the start of the month. The standing repo facility exists now, with roughly half a trillion of capacity, and take-up on 20 August was one million dollars — which is to say, nothing at all. On the plumbing’s own instruments, this is a calm market.
Against it: reserves are down $382bn on the year. Concentration has gone from eighty-four per cent to ninety. Exposure has doubled. And the fix designed after the last crisis arrives in the middle of the largest position anyone has ever run — central clearing of Treasury cash trades becomes mandatory on 31 December 2026, and of repo on 30 June 2027, with FICC and CME’s clearing subsidiary as the approved counterparties.
That is four months away. It is, on balance, the right reform: it replaces bilateral haircut discretion — a great deal of this repo has been financed at zero haircut — with something consistent. But consistency cuts the other way in stress. A central counterparty’s margin model does not negotiate and does not stagger its calls. It asks everyone for cash on the same morning. The reform removes the risk that a dealer quietly stops funding one client and replaces it with the risk that a model asks fifty funds for variation margin simultaneously.
What to watch
Not USD/JPY. It is the loudest instrument here and the least informative.
- SOFR against interest on reserves, and the 99th-percentile SOFR print. The cleanest public read on whether dealers have room.
- Standing repo facility take-up. Any use that is not a scheduled test is a signal, not noise.
- The long-end commercial extreme, every Tuesday, in this desk’s ledger — and whether the front end stays at the other end of its range.
- Ten-year open interest. 5.60 million contracts on 18 August and rising.
- The Bank of Japan in September, with roughly eighty per cent of a hike priced, and the Japan–US ten-year gap around 1.8 points.
The yen carry trade will be blamed for the next accident, as it was for the last one, and the blame will be half right in the way that is least useful. The yen is the match. What the fire needs is somewhere to go, and what it has is four trillion dollars of Treasury exposure financed overnight, ninety per cent of it in fifty firms, in a market that has proved it can survive being frightened and has never had to prove it can survive being defunded.
Informational and educational only — not financial advice. Futures trading involves substantial risk of loss; seasonal and positioning signals do not guarantee future results. Signals and charts: ChartHorizon (local end-of-day data).