Priced in Dollars
Chicago wheat closed limit up on 26 August, corn and soybeans at contract highs, on Black Sea export risk — and the producers were already short into it.
Prices through 26 August 2026 · COT through the 18 August report · Data: ChartHorizon, CFTC, USDA, SovEcon & press reports · Charts: ChartHorizon
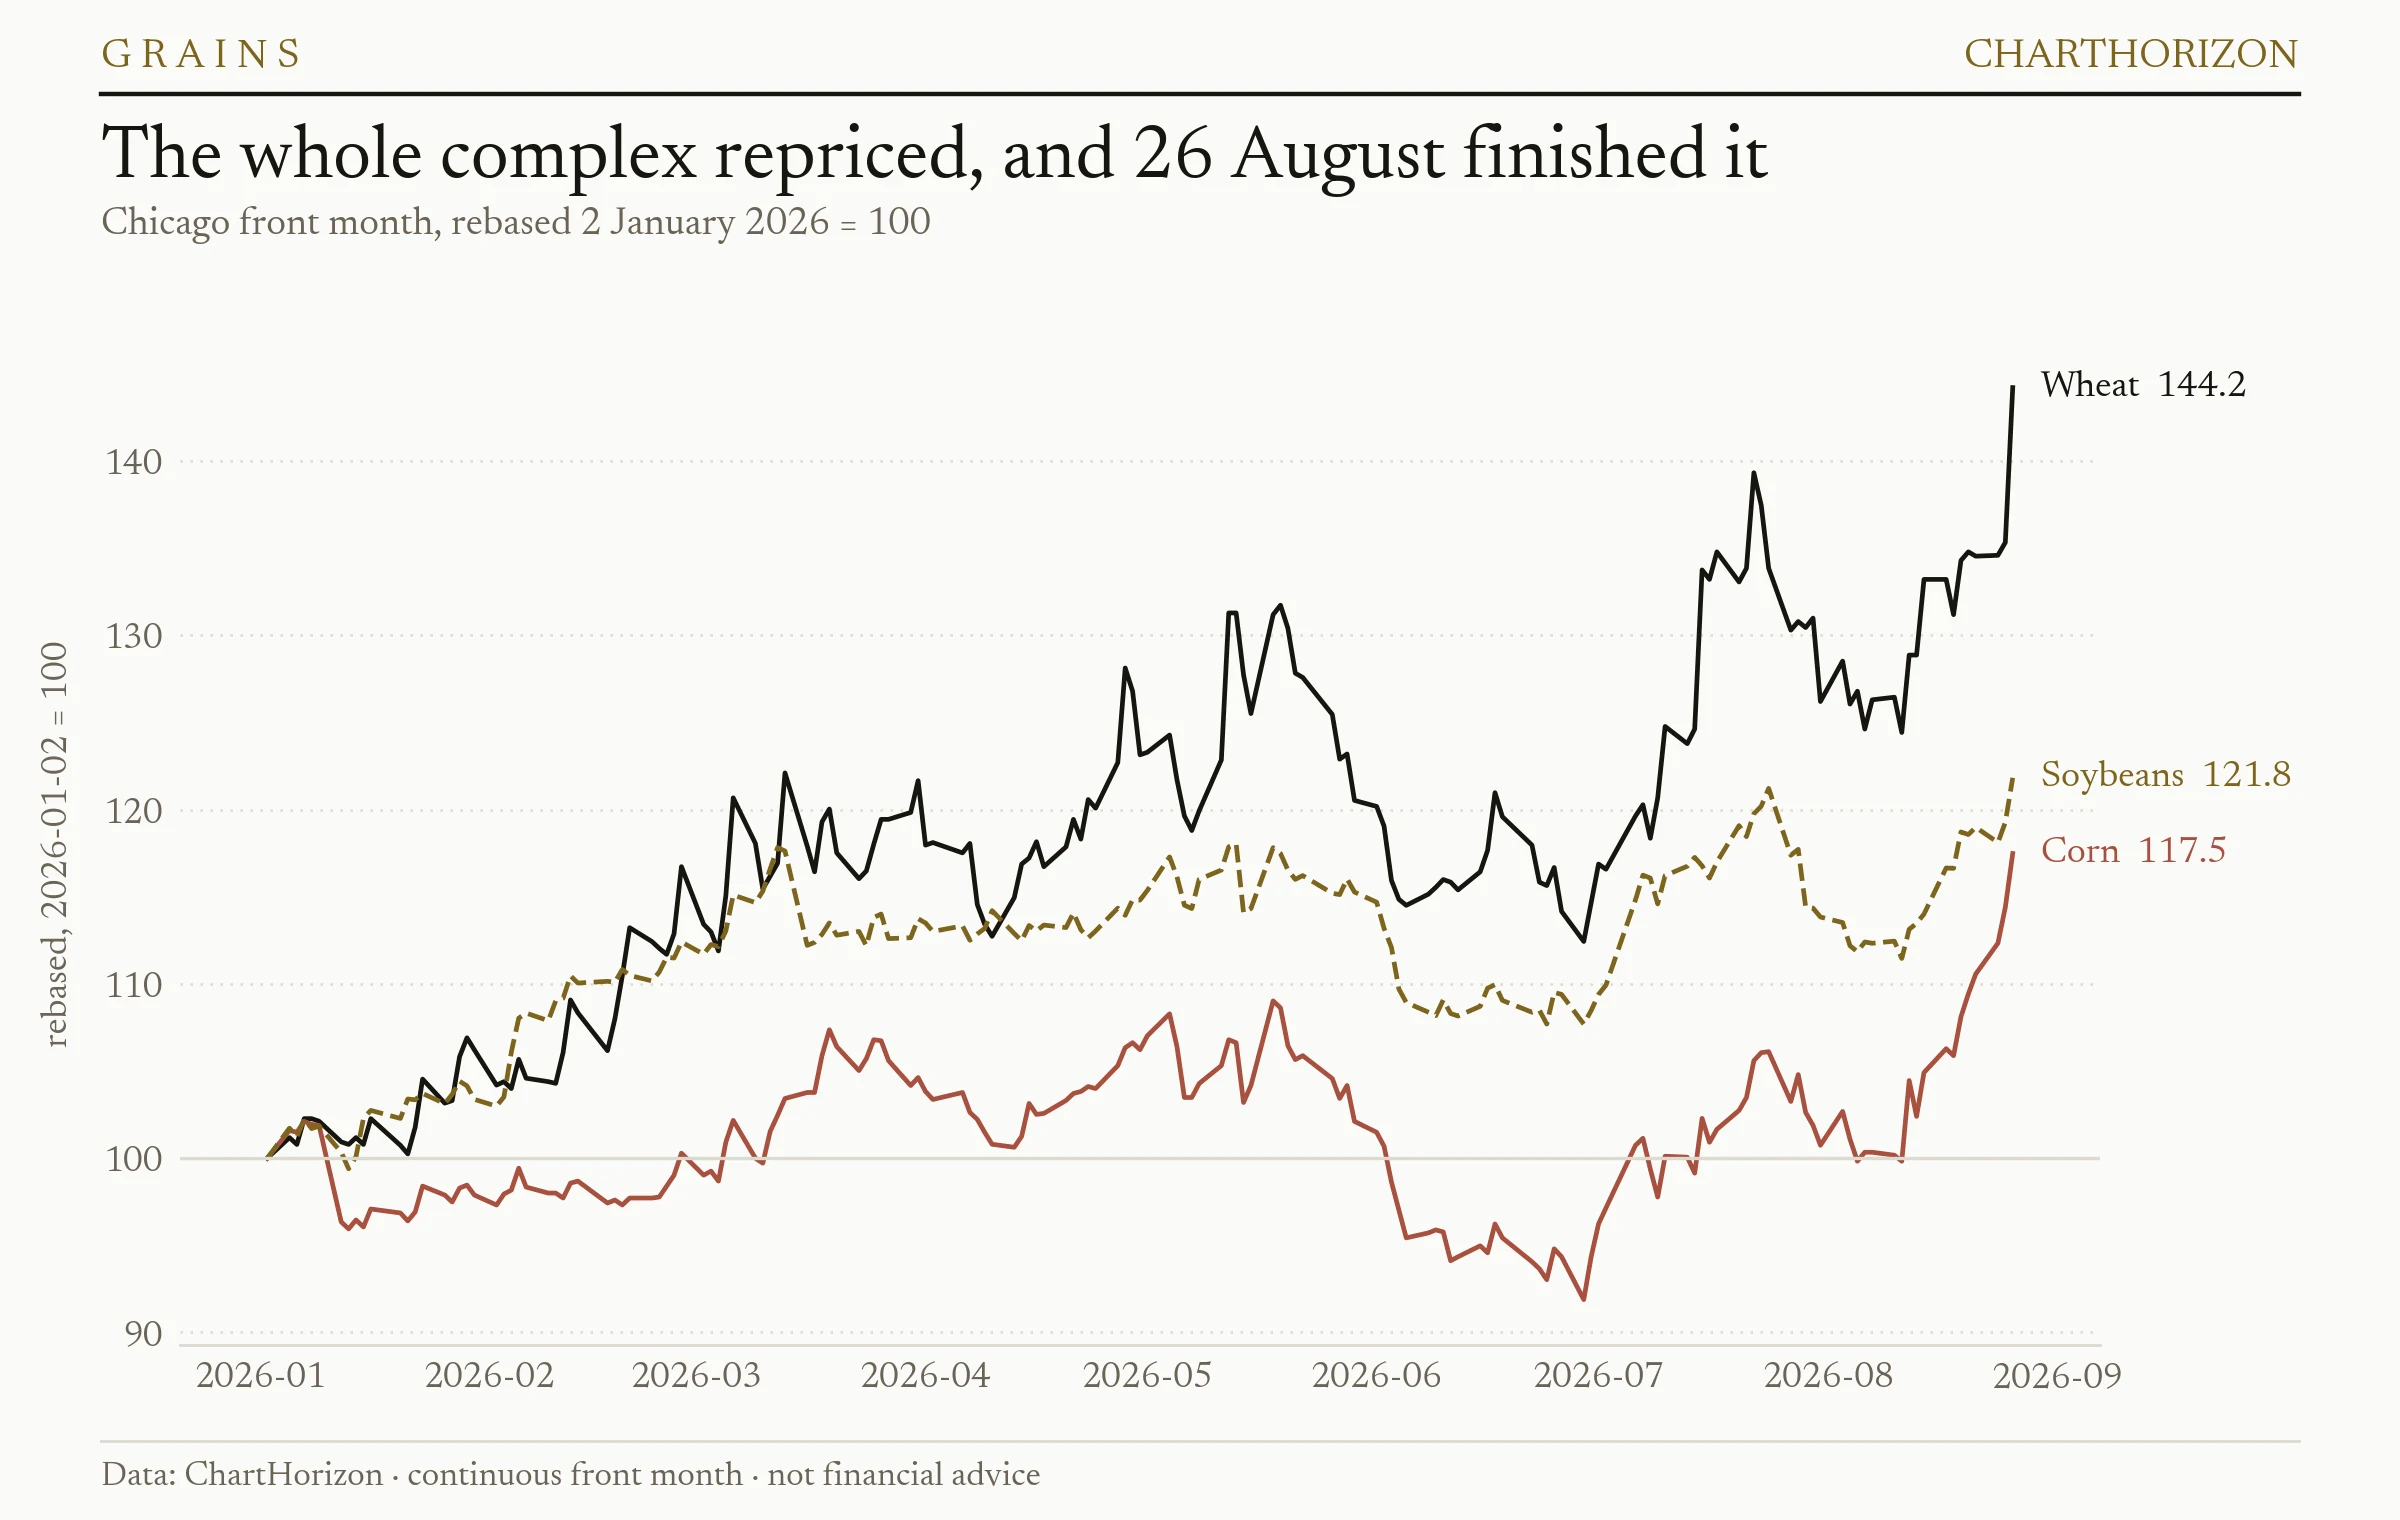
December wheat settled limit up on Wednesday, 45 cents higher at $7.48¼. December corn took 13 cents to a contract high of $5.36½; November soybeans took 28¼ to a contract high of $12.66. On this desk’s continuous front month, wheat closed at 730½ — up 6.56 per cent in a session and the highest close since July 2023. Corn’s 514 is also a three-year high. Soybeans at 1254¼ are the best since January 2024. The exchange widens wheat’s daily limit to 70 cents today, which is the exchange saying it expects more.
The supply half, which is real
Two things were already true before Wednesday. The first is that Russia cannot ship. Ukrainian strikes on the Azov-Black Sea basin have taken more than ninety per cent of Russia’s grain export capacity offline: navigation in the Sea of Azov has been suspended since July, the Taman terminal stopped in late July, and the 12 August strike on Novorossiysk halted all three terminals there — together roughly 25 million tonnes of annual throughput. Tuapse is the only deep-water grain terminal still working. SovEcon puts Russian wheat exports this month at 3.0 to 3.4 million tonnes against a five-year August average of 5 million, which would be the weakest August since 2016/17. Russia moved 46.3 million tonnes through these ports last season. This is not a rumour about supply; it is supply that is demonstrably not moving.
The second is that the American crop got smaller while nobody was looking at it. USDA’s good-to-excellent rating for corn fell to 57 per cent this week, from 60 the week before and 71 a year ago. The Pro Farmer tour came back with 173.2 bushels an acre against USDA’s 180.7 — a 15.344-billion-bushel crop, not the record. Scouts kept reporting the same thing: fields that looked healthy until you pulled an ear and found the grain length wasn’t there, after a cold snap at emergence and one of the wettest Junes on record.
What actually triggered Wednesday was neither of those. It was a diplomatic headline — Bloomberg reporting that Moscow now treats the peace track as dead and is weighing heavier missile use against Kyiv. The tinder had been stacked since 12 August. The market spent Wednesday deciding the fire would not be put out.
One detail worth keeping: soybean oil fell 0.44 per cent on the day, the only member of the complex that did. This is not a general agricultural inflation trade. It is a grain-supply trade, and it is priced as one.
Who was already short
The people who own the physical grain had a view on this rally, and they filed it eight days before the limit-up. In the Commitments of Traders report dated 18 August, the producer/merchant net position — the elevators, the processors, the farmers with grain in the bin — sat at 66,453 contracts net short in Chicago wheat. Only four weekly reports in three years found them shorter. Corn’s 589,440 net short is in the deepest eight per cent of three years; soybeans’ 273,666 in the deepest fifteen.
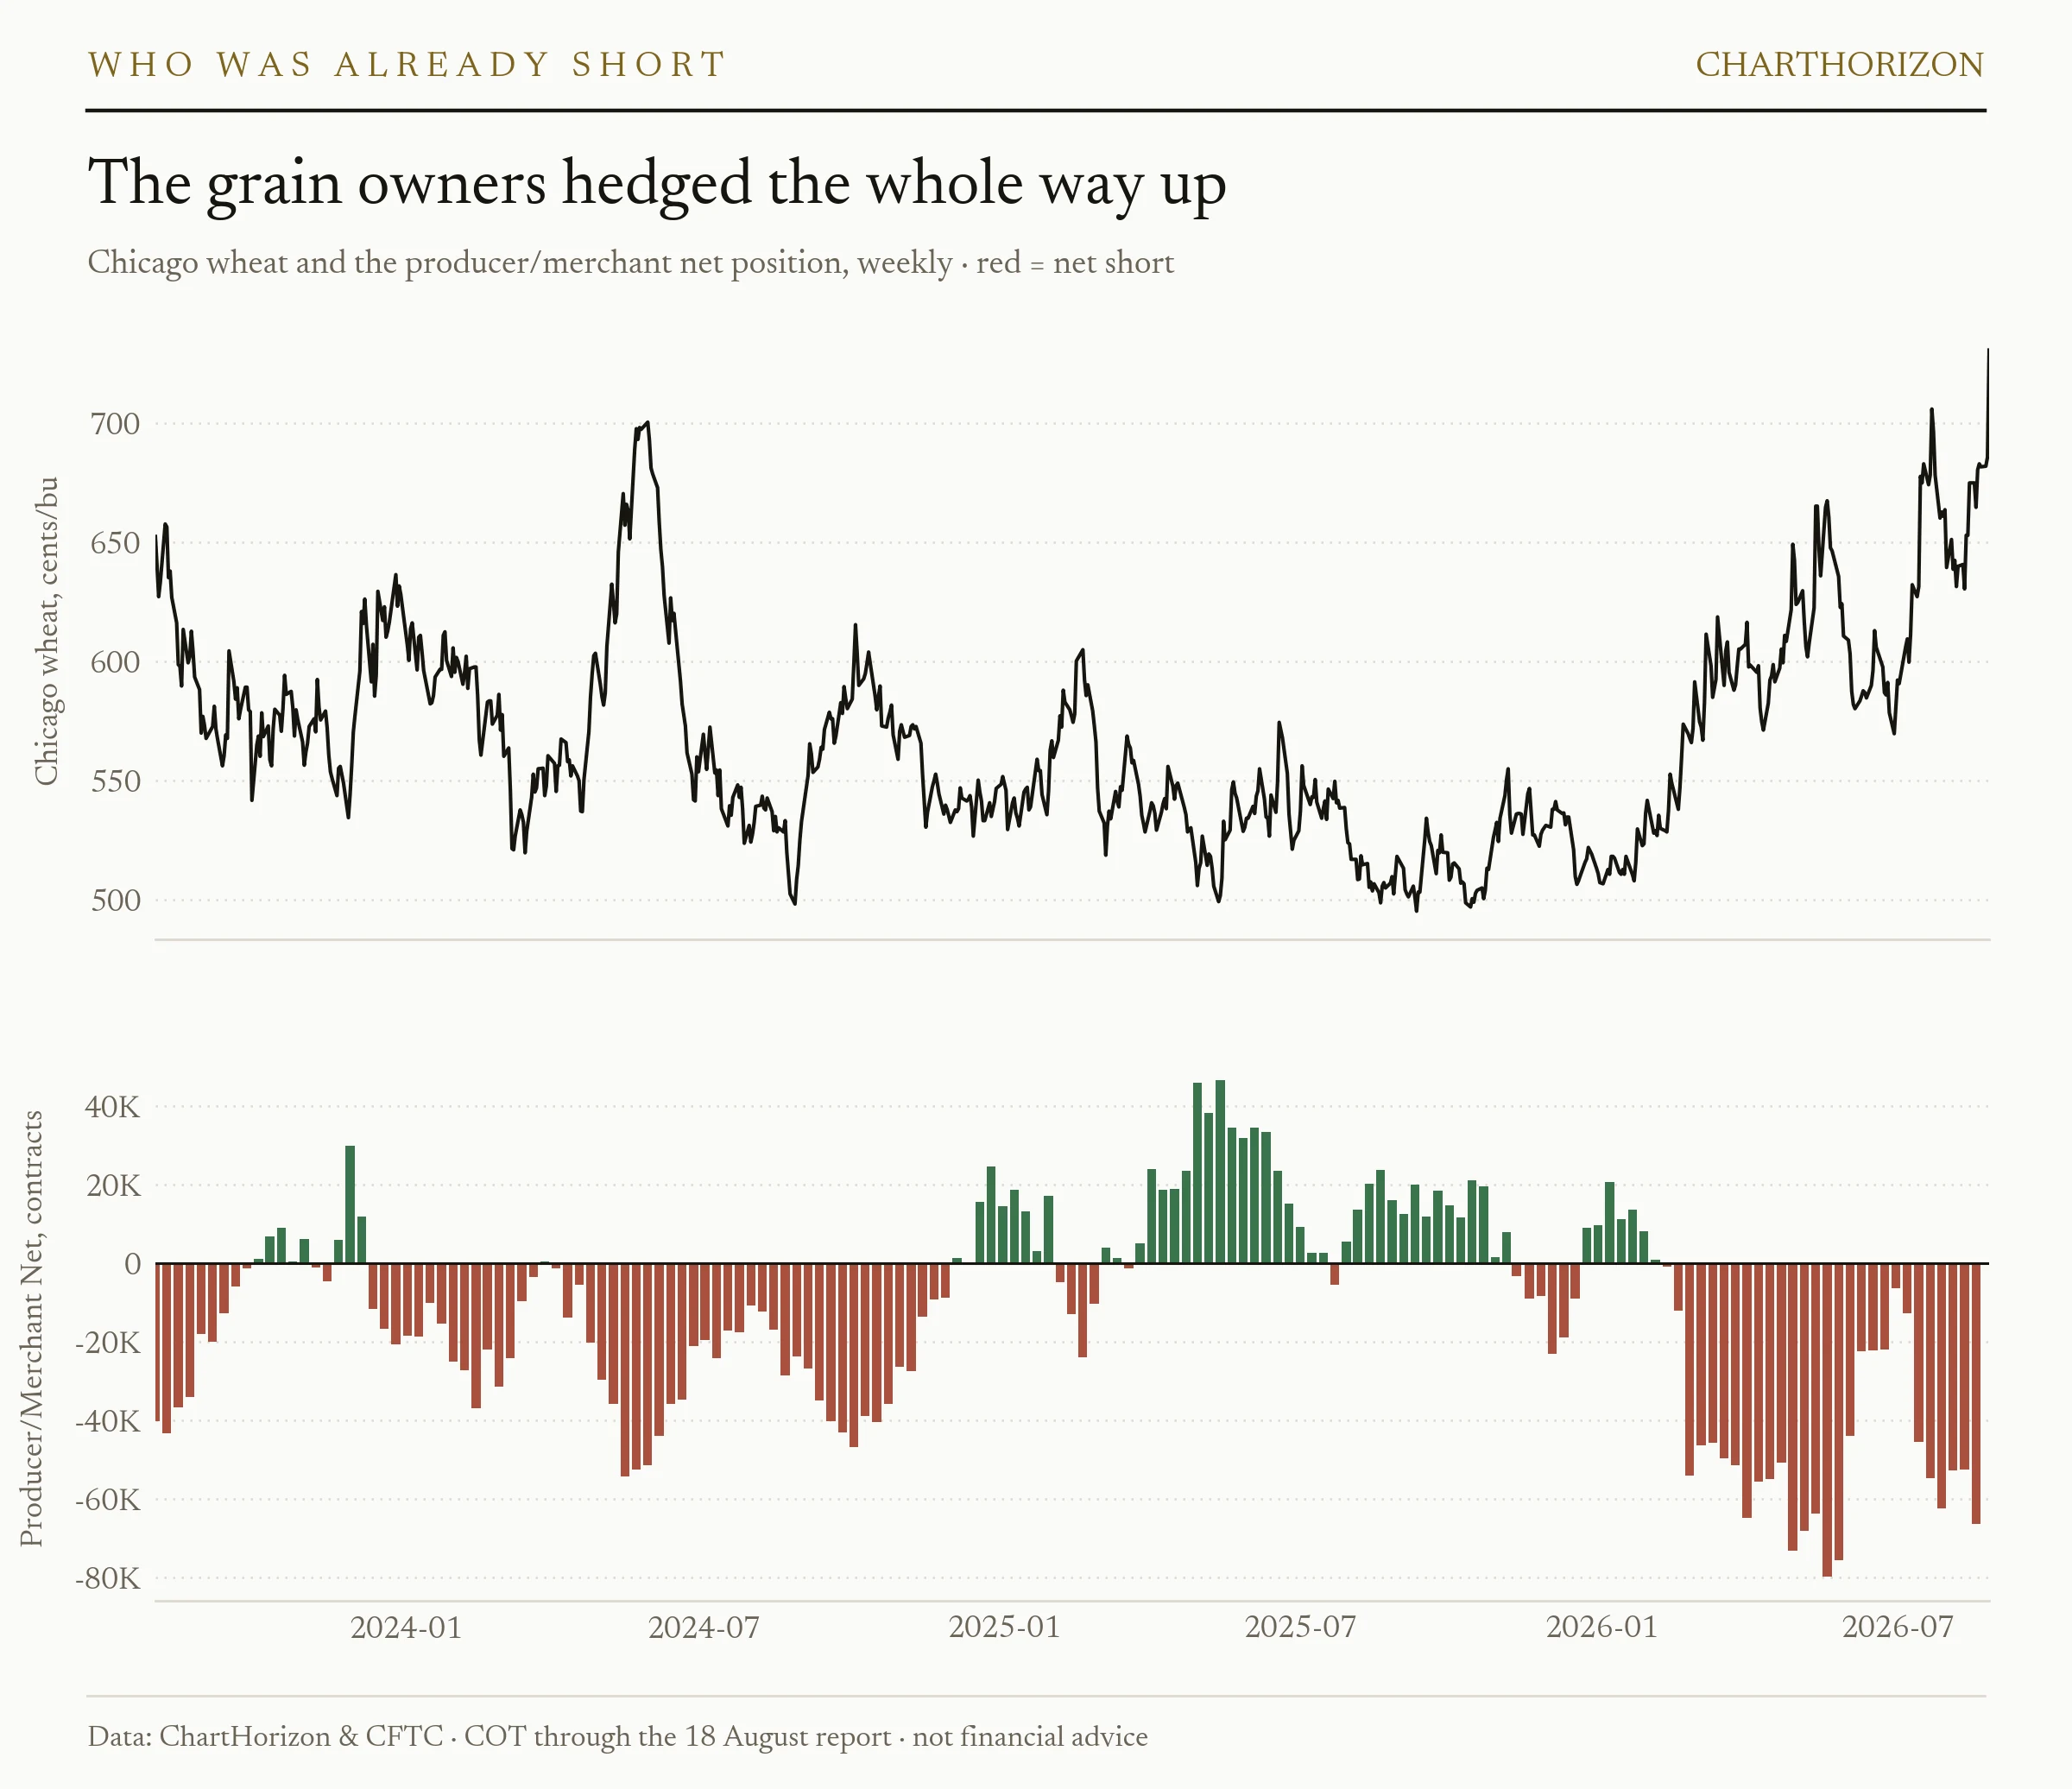
The tempting read is that this is a top. It is worth resisting, because this desk’s own archive says it hasn’t been one. The five deepest producer shorts in wheat over three years all occurred between March and May of this year — and wheat is higher today than at every one of them. From the deepest of the lot, 79,824 net short on 19 May with wheat at 667¼, the market is up nine and a half per cent. Producers hedging heavily is what producers do when the price is good. It tells you who has already acted. It does not tell you what happens next.
The 2022 case, where it did matter
There is one episode in this archive where extreme producer hedging preceded a collapse, and it is the one everybody will reach for this week. The six deepest corn producer shorts on record here — the archive starts in June 2021 — all fall between March and May 2022, the months after the invasion.
The March cluster led nowhere: corn was at 754½ on 8 March and 757 thirteen weeks later. The late-April cluster was different. Corn closed at 804 on 19 April, the week producers went 760,107 short, and thirteen weeks later it was 596¾ — down 26 per cent. Wheat peaked at 1425¼ on 7 March 2022 and traded 759 on 22 July, a fall of 47 per cent.
Here is the part that matters. The Black Sea Grain Initiative was signed on 22 July 2022. Close to three-fifths of wheat’s decline was already done by mid-June, five weeks before anyone signed anything. The disruption was still fully in place while the premium drained out of the price. Something other than supply was doing the work.
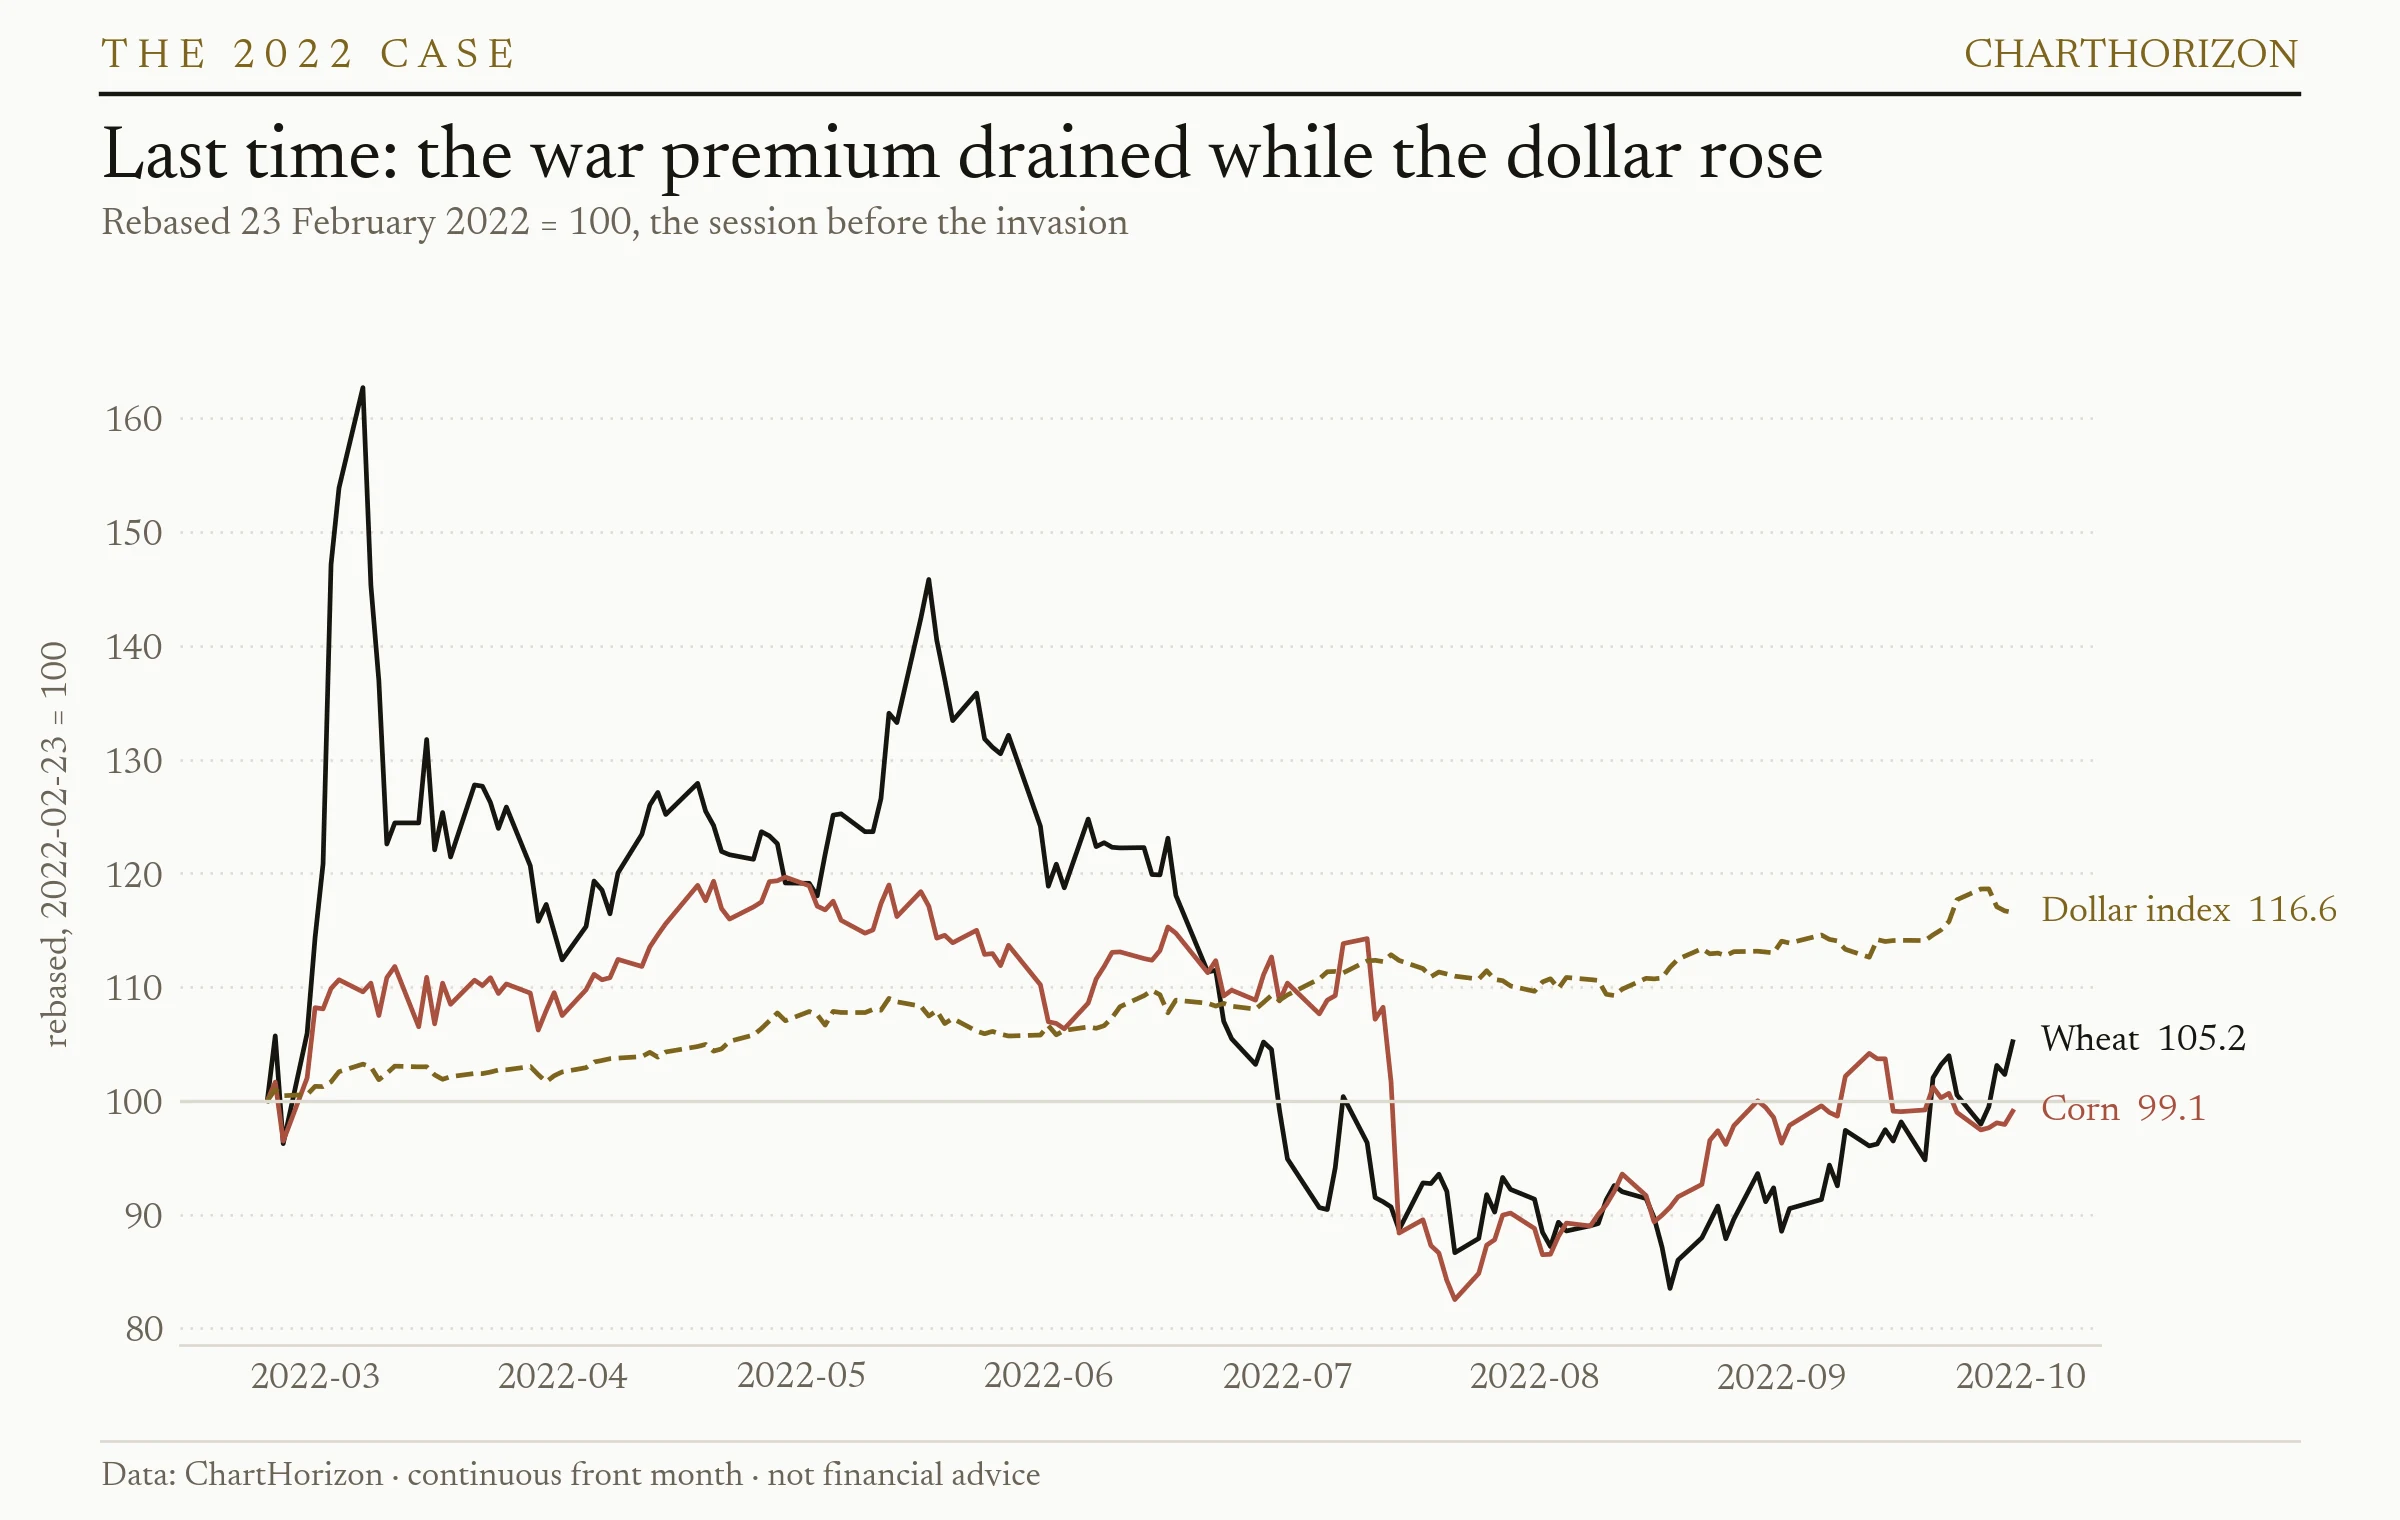
That something is on the chart. Over the same months the dollar index went from 96.19 the session before the invasion to 112.12 by the end of September, on its way to 114.11. A bushel is priced in dollars and cleared in dollars. Every importer paying for American grain in a currency that is falling against the dollar faces a rising price even when Chicago is flat, and the demand that justified the spike stops showing up. The war premium did not leave because the war ended. It left because the buyer could no longer afford it.
The dollar half, which is the open question
The dollar closed at 99.17 on Wednesday, up a quarter of a per cent on the day the grains went limit up. That is mid-range for a year that has run between 96.22 and 101.61. A soft dollar has been a quiet tailwind under this whole grain move, and it is the part of the trade nobody has had to think about.
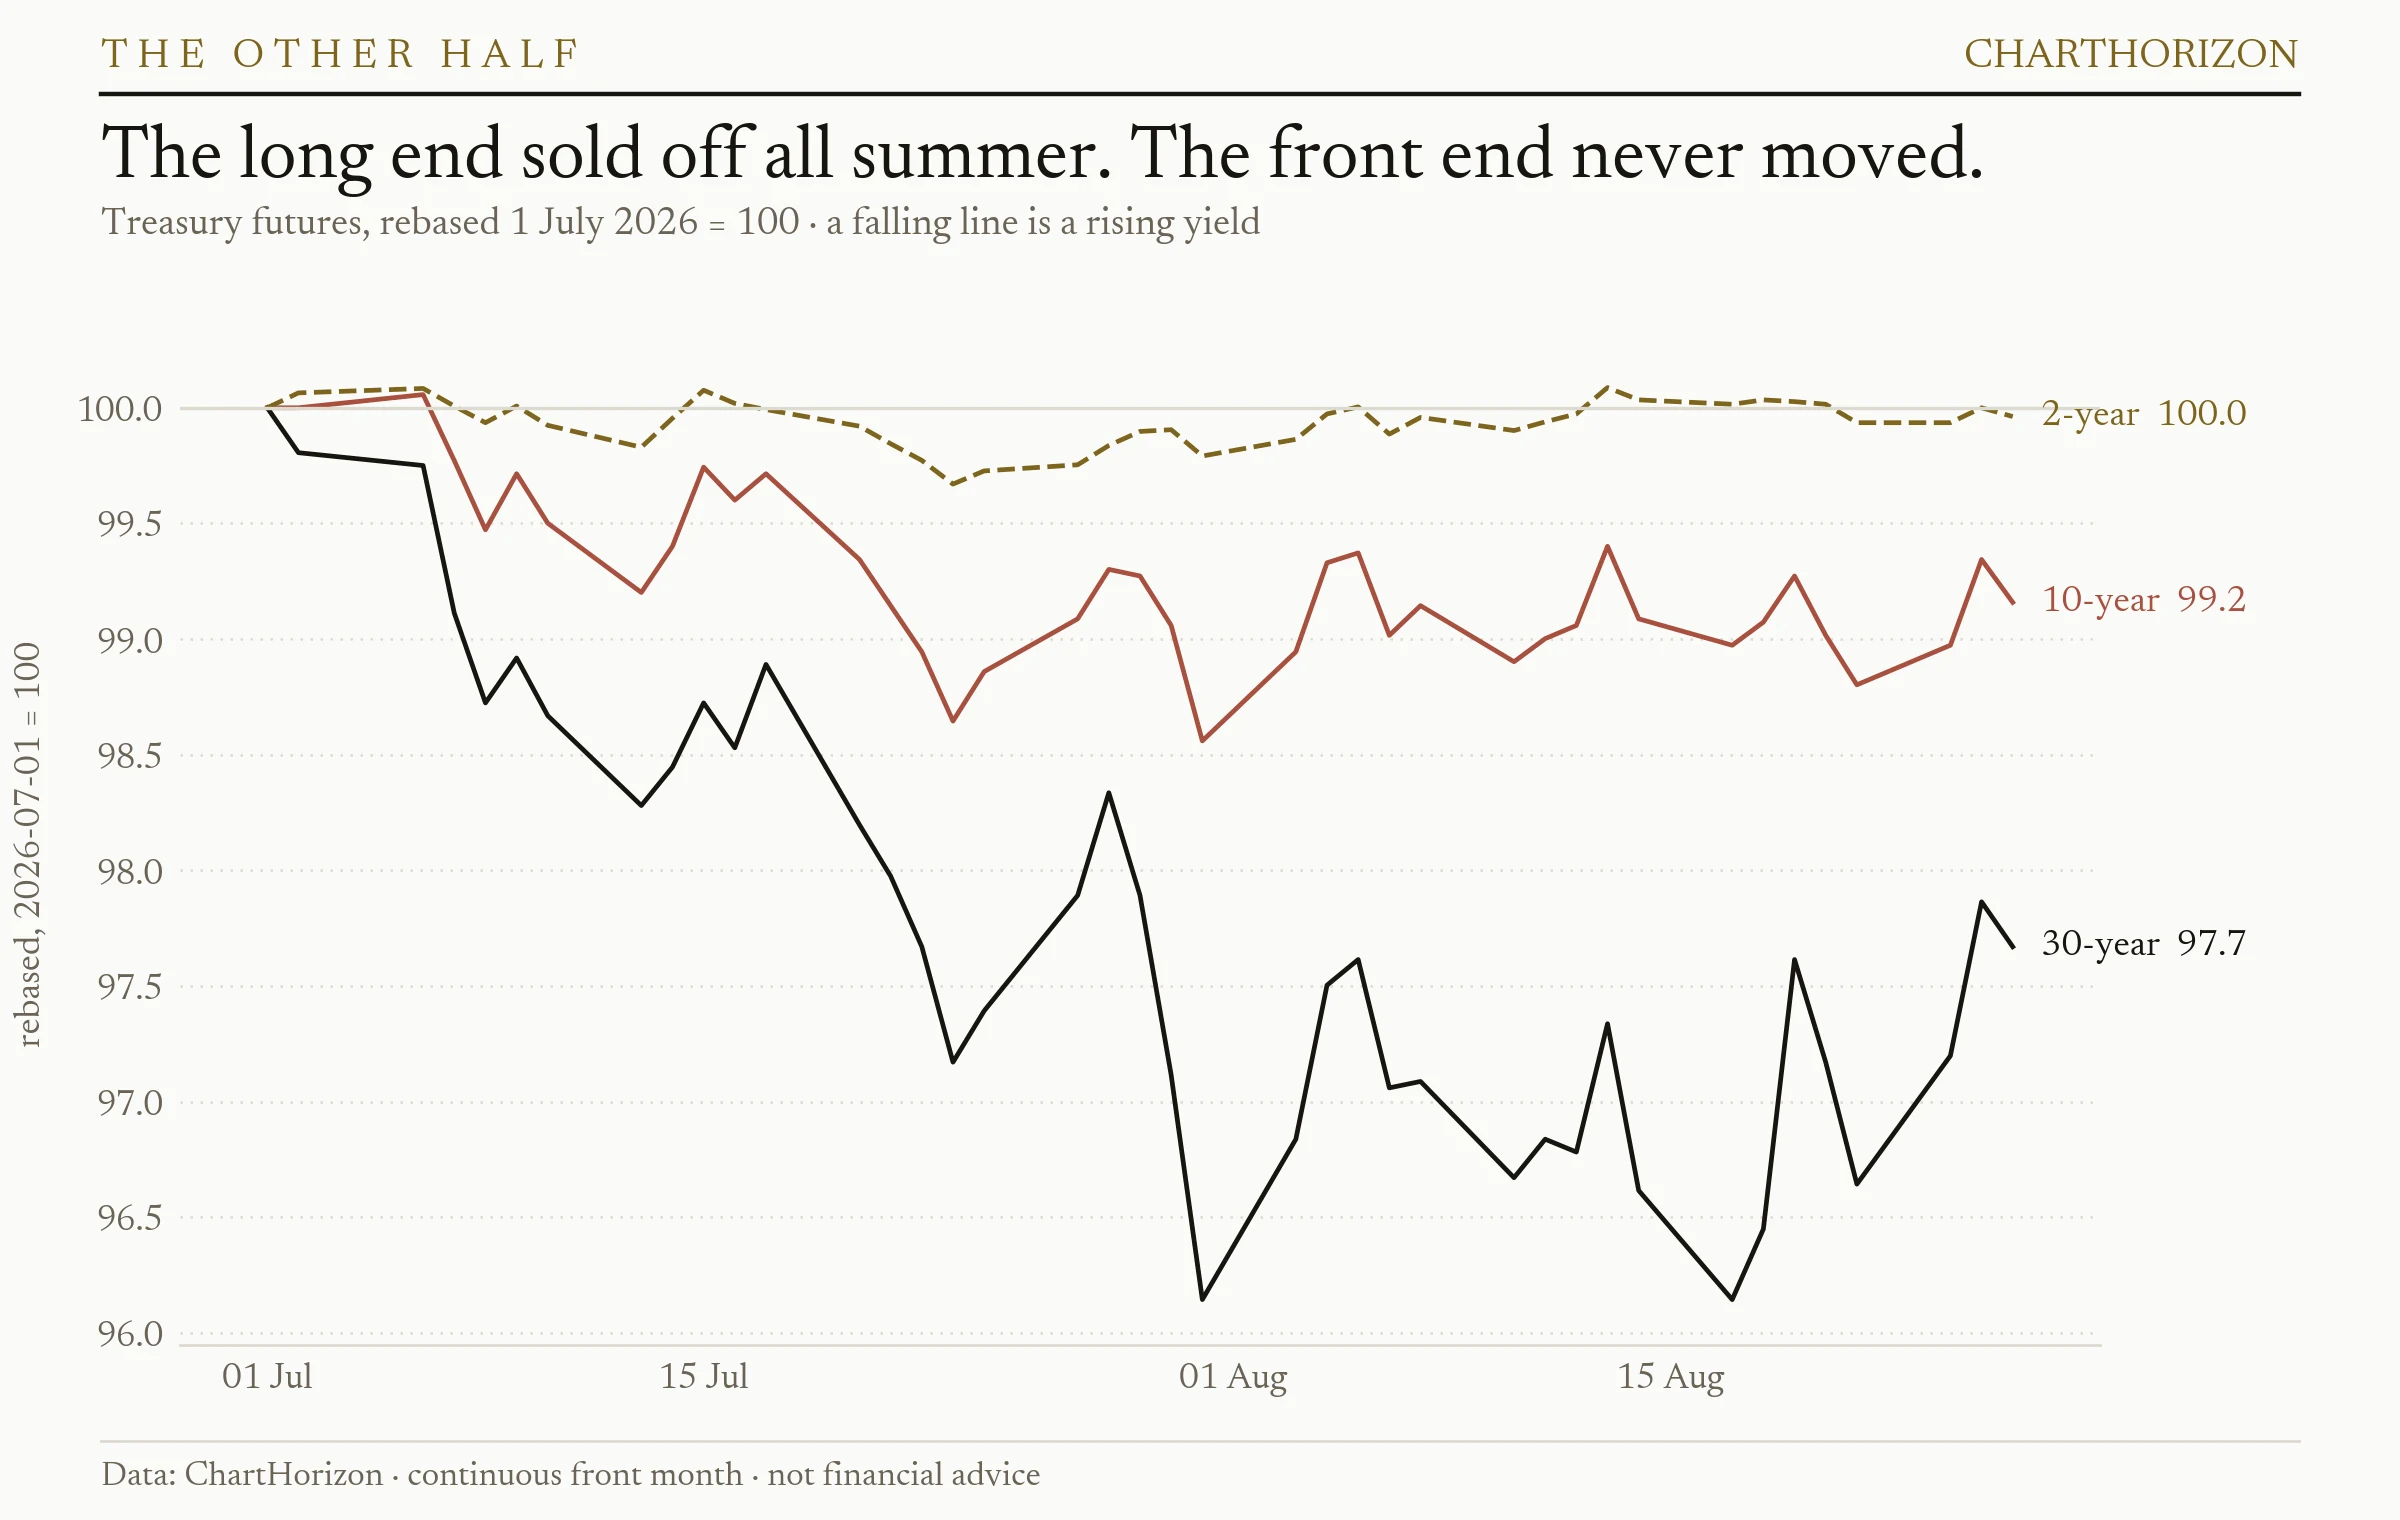
The Treasury curve is where the thinking is happening. Since 1 July, thirty-year futures are down 2.3 per cent and ten-years down 0.8 — long-end yields rising hard, with the thirty-year cash yield at 5.31 per cent on 17 August, the highest since 2007. The two-year is unchanged over the same stretch. That is a term-premium move, not a policy move, and the flat front end is the tell: after two months of the long end selling off, the market has priced in no relief at all.
Kevin Warsh gives his first Jackson Hole keynote as Fed chair on Friday. His debut meeting on 29 July held rates but stripped the easing bias out of the statement, and nine of eighteen participants marked a hike this year; the median end-2026 rate moved to 3.8 per cent from 3.4. Inflation is running near 4.2 per cent. For the 15–16 September meeting the market still favours a hold, with hike odds around one in three.
The asymmetry is the point. With nothing priced at the front end, a hawkish Friday has room to push the dollar up and a dovish one has very little room to push it down. That is not a forecast about what Warsh will say. It is an observation about which direction the surprise can travel.
What would settle it
The supply story is real and does not need anyone’s permission to keep working — Russia’s ports are not coming back this month, and the American crop is not getting bigger between now and the combine. But 2022 is the standing proof that a war premium can drain out of grain while the disruption stays exactly where it is, and the mechanism that drained it was the dollar.
Three things to watch, none of them requiring an opinion. Whether the front end starts pricing relief after Friday, or stays flat and lets the dollar work higher. Whether the export book keeps clearing at these levels — China has been taking two-thirds of new-crop soybean sales, and a 132,000-tonne purchase landed during Wednesday’s session, which is the demand side voting with money. And the Commitments report dated 1 September, out on the 4th — the first one whose Tuesday cut-off falls after the limit-up, and so the first that can show what the people holding actual grain did with it.
They were short before the news arrived. What they did with it is worth waiting eight days to read.
Informational and educational only — not financial advice. Futures trading involves substantial risk of loss; seasonal and positioning signals do not guarantee future results. Signals and charts: ChartHorizon (local end-of-day data).